Safeway 2010 Annual Report Download - page 82
Download and view the complete annual report
Please find page 82 of the 2010 Safeway annual report below. You can navigate through the pages in the report by either clicking on the pages listed below, or by using the keyword search tool below to find specific information within the annual report.-
 1
1 -
2
-
3
-
4
-
5
-
6
-
7
-
8
-
9
-
10
-
11
-
12
-
13
-
14
-
15
-
16
-
17
-
18
-
19
-
20
-
21
-
22
-
23
-
24
-
25
-
26
-
27
-
28
-
29
-
30
-
31
-
32
-
33
-
34
-
35
-
36
-
37
-
38
-
39
-
40
-
41
-
42
-
43
-
44
-
45
-
46
-
47
-
48
-
49
-
50
-
51
-
52
-
53
-
54
-
55
-
56
-
57
-
58
-
59
-
60
-
61
-
62
-
63
-
64
-
65
-
66
-
67
-
68
-
69
-
70
-
71
-
 72
72 -
 73
73 -
 74
74 -
 75
75 -
 76
76 -
 77
77 -
 78
78 -
 79
79 -
 80
80 -
 81
81 -
 82
82 -
 83
83 -
 84
84 -
 85
85 -
 86
86 -
 87
87 -
 88
88 -
 89
89 -
 90
90 -
 91
91 -
 92
92 -
93
-
94
-
95
-
96
 |
 |

SAFEWAY INC. AND SUBSIDIARIES
Notes to Consolidated Financial Statements
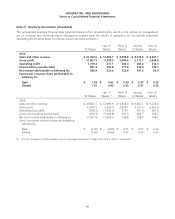
Note Q: Quarterly Information (Unaudited)
The summarized quarterly financial data presented below reflect all adjustments, which in the opinion of management,
are of a normal and recurring nature necessary to present fairly the results of operations for the periods presented.
(Rounding affects some totals. In millions, except per-share amounts.)
52 Weeks
Last 16
Weeks
Third 12
Weeks
Second
12 Weeks
First 12
Weeks
2010
Sales and other revenue $ 41,050.0 $ 12,803.7 $ 9,399.6 $ 9,519.5 $ 9,327.1
Gross profit 11,607.5 3,595.5 2,644.6 2,717.7 2,649.6
Operating profit 1,159.4 417.1 242.4 285.2 214.5
Income before income taxes 881.2 336.8 177.8 218.4 148.1
Net income attributable to Safeway Inc. 589.8 229.6 122.8 141.3 96.0
Income per common share attributable to
Safeway Inc.
Basic $ 1.56 $ 0.62 $ 0.33 $ 0.37 $ 0.25
Diluted 1.55 0.62 0.33 0.37 0.25
52 Weeks
Last 16
Weeks (1)
Third 12
Weeks
Second
12 Weeks
First 12
Weeks
2009
Sales and other revenue $ 40,850.7 $ 12,693.9 $ 9,458.3 $ 9,462.1 $ 9,236.4
Gross profit 11,693.5 3,635.0 2,674.1 2,731.5 2,652.9
Operating (loss) profit (628.7) (1,545.9) 278.1 357.6 281.5
(Loss) income before income taxes (953.3) (1,642.8) 201.3 283.7 204.5
Net (loss) income attributable to Safeway Inc. (1,097.5) (1,609.1) 128.8 238.6 144.2
(Loss) income per common share attributable to
Safeway Inc.
Basic $ (2.66) $ (4.06) $ 0.31 $ 0.57 $ 0.34
Diluted (2.66) (4.06) 0.31 0.57 0.34
(1) The last 16 weeks of 2009 includes a pre-tax goodwill impairment charge of $1,974.2 million. See Note B.
66