Safeway 2010 Annual Report Download - page 78
Download and view the complete annual report
Please find page 78 of the 2010 Safeway annual report below. You can navigate through the pages in the report by either clicking on the pages listed below, or by using the keyword search tool below to find specific information within the annual report.-
 1
1 -
2
-
3
-
4
-
5
-
6
-
7
-
8
-
9
-
10
-
11
-
12
-
13
-
14
-
15
-
16
-
17
-
18
-
19
-
20
-
21
-
22
-
23
-
24
-
25
-
26
-
27
-
28
-
29
-
30
-
31
-
32
-
33
-
34
-
35
-
36
-
37
-
38
-
39
-
40
-
41
-
42
-
43
-
44
-
45
-
46
-
47
-
48
-
49
-
50
-
51
-
52
-
53
-
54
-
55
-
56
-
57
-
58
-
59
-
60
-
61
-
62
-
63
-
64
-
65
-
66
-
67
-
 68
68 -
 69
69 -
 70
70 -
 71
71 -
 72
72 -
 73
73 -
 74
74 -
 75
75 -
 76
76 -
 77
77 -
 78
78 -
 79
79 -
 80
80 -
 81
81 -
 82
82 -
 83
83 -
 84
84 -
 85
85 -
 86
86 -
 87
87 -
 88
88 -
89
-
90
-
91
-
92
-
93
-
94
-
95
-
96
 |
 |

SAFEWAY INC. AND SUBSIDIARIES
Notes to Consolidated Financial Statements
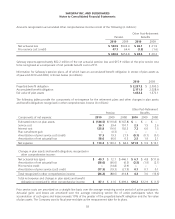
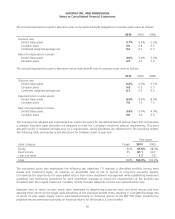
The fair value of Safeway’s pension plan assets at January 2, 2010, excluding pending transactions of $32.2 million, by
asset category are as follows (in millions):
Fair Value Measurements
Asset category: Total
Quoted prices in
active markets
for identical
assets
(Level 1)
Significant
observable
inputs
(Level 2)
Significant
unobservable
inputs
(Level 3)
Cash and cash equivalents $ 12.8 $ 11.5 $ 1.3 $ –
Short-term investment collective trust 21.7 – 21.7 –
Common and preferred stock:
Domestic common and preferred stock 440.7 440.1 0.6 –
International common stock 32.8 32.8 – –
Common collective trust funds 680.8 – 680.8 –
Corporate bonds 89.5 – 86.6 2.9
Mortgage- and other-asset backed securities 49.0 – 46.5 2.5
Mutual funds 31.0 31.0 – –
U.S. government securities 162.7 – 162.5 0.2
Other securities 18.9 – 18.7 0.2
Total $1,539.9 $515.4 $1,018.7 $5.8
See Note F for a discussion of levels, inputs and valuation techniques.
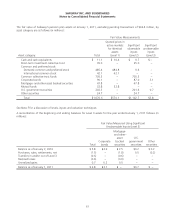
A reconciliation of the beginning and ending balances for Level 3 assets for the year ended January 2, 2010 follows (in
millions):
Fair Value Measured Using Significant
Unobservable Inputs (Level 3)
Total
Corporate
bonds
Mortgage-
and other-
asset
backed
securities
U.S.
government
securities
Other
securities
Balance as of January 3, 2009 $ 1.5 $ 0.6 $ 1.1 $ 0.3 $(0.5)
Purchases, sales, settlements, net 3.3 2.5 0.4 (0.1) 0.5
Transfers in and/or out of Level 3 1.6 – 1.6 – –
Realized (losses) gains (0.9) (0.5) (0.6) – 0.2
Unrealized gains 0.3 0.3 – – –
Balance as of January 2, 2010 $ 5.8 $ 2.9 $ 2.5 $ 0.2 $ 0.2
Contributions Safeway expects to contribute approximately $175 million to its defined benefit pension plan and post-
retirement benefit plans in 2011.
62