Safeway 2010 Annual Report Download - page 4
Download and view the complete annual report
Please find page 4 of the 2010 Safeway annual report below. You can navigate through the pages in the report by either clicking on the pages listed below, or by using the keyword search tool below to find specific information within the annual report.-
 1
1 -
 2
2 -
 3
3 -
 4
4 -
 5
5 -
 6
6 -
 7
7 -
 8
8 -
 9
9 -
 10
10 -
 11
11 -
 12
12 -
 13
13 -
 14
14 -
 15
15 -
16
-
17
-
18
-
19
-
20
-
21
-
22
-
23
-
24
-
25
-
26
-
27
-
28
-
29
-
30
-
31
-
32
-
33
-
34
-
35
-
36
-
37
-
38
-
39
-
40
-
41
-
42
-
43
-
44
-
45
-
46
-
47
-
48
-
49
-
50
-
51
-
52
-
53
-
54
-
55
-
56
-
57
-
58
-
59
-
60
-
61
-
62
-
63
-
64
-
65
-
66
-
67
-
68
-
69
-
70
-
71
-
72
-
73
-
74
-
75
-
76
-
77
-
78
-
79
-
80
-
81
-
82
-
83
-
84
-
85
-
86
-
87
-
88
-
89
-
90
-
91
-
92
-
93
-
94
-
95
-
96
 |
 |
2
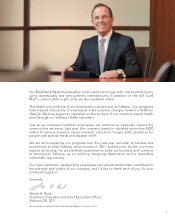
In 2010, we continued to listen closely to our customers and focus on improving their
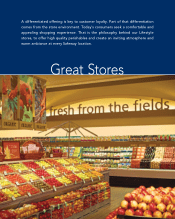
shopping experience in nearly every way. We advanced our strategy of differentiating
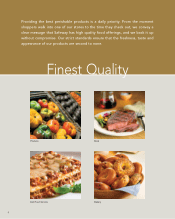
our offering by providing high quality products, great stores and legendary service,
and achieved our objective of offering lower prices. Our efforts are paying off,
resulting in a more innovative company with exceptional product offerings and more
loyal customers—all of which we believe set a strong foundation from which to grow.
In 2010, total sales increased to $41.1 billion, compared with $40.9 billion in 2009.
Excluding fuel, identical store sales decreased 2%. Throughout the year, consumers
continued to closely monitor their spending. While deflation continued to impact
pricing and sales overall, inflation returned in the second half of the year in key
categories such as dairy, produce and meat, and is expected to continue in 2011.
Net income for 2010 was $589.8 million, equal to $1.55 per diluted share, compared
with a net loss of $1,097.5 million, or $2.66 per diluted share, in 2009. Excluding the
goodwill impairment charge of $1,818.2 million, net of tax ($4.40 per diluted share),
net income would have been $720.7 million ($1.74 per diluted share) in 2009.1
We generated strong free cash flow of $1.1 billion1 in 2010, and returned $789 million
to our shareholders through $621 million in stock repurchases and $168 million in
dividends. At the same time, debt was reduced by $65 million.
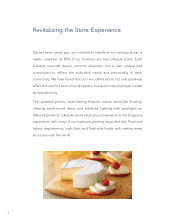
Our Lifestyle store renovations are almost complete, with 85% of our 1,694 locations
now transformed into Lifestyle stores. During the year, we opened or remodeled 74
of these stores to further enhance the Safeway shopping experience. One of the
highlights was the grand reopening of our Georgetown replacement store in May.
We doubled the size of the store, increased the product selection and established
a unique shopping environment, much to the delight of local residents.
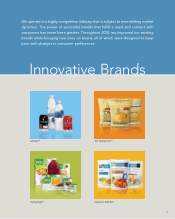
As part of an exceptional customer experience, we continue to develop and evolve
a portfolio of innovative brands that consumers trust and enjoy. We relaunched our
14 beverage brands under the refreshe™ label, and have seen a resurgence in sales.
We also introduced The Snack Artist™ snack and chip line with contemporary,
resealable packaging and memorable headlines.
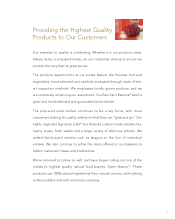
We remain committed to providing healthy living options for our customers. We
added new products and new brands such as Open Nature™ to our Health and
Wellness portfolio. The Open Nature™ line of natural products launched at the
end of 2010 in a select number of stores, offering great-tasting, 100% natural food
products with no artificial flavors or preservatives.
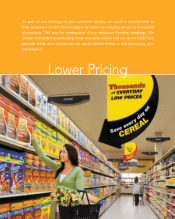
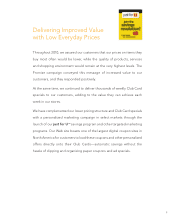
Pricing continues to drive consumer action and our value-driven Promise campaign
resonated well with our customers. In addition, we introduced our just for U™
personalized pricing and digital couponing campaign in select markets, offering a
wide array of special incentives customers can load directly onto their Club Card
through our Web site.
Dear Fellow Stockholders: