Safeway 2010 Annual Report Download - page 38
Download and view the complete annual report
Please find page 38 of the 2010 Safeway annual report below. You can navigate through the pages in the report by either clicking on the pages listed below, or by using the keyword search tool below to find specific information within the annual report.-
 1
1 -
2
-
3
-
4
-
5
-
6
-
7
-
8
-
9
-
10
-
11
-
12
-
13
-
14
-
15
-
16
-
17
-
18
-
19
-
20
-
21
-
22
-
23
-
24
-
25
-
26
-
27
-
 28
28 -
 29
29 -
 30
30 -
 31
31 -
 32
32 -
 33
33 -
 34
34 -
 35
35 -
 36
36 -
 37
37 -
 38
38 -
 39
39 -
 40
40 -
 41
41 -
 42
42 -
 43
43 -
 44
44 -
 45
45 -
 46
46 -
 47
47 -
 48
48 -
49
-
50
-
51
-
52
-
53
-
54
-
55
-
56
-
57
-
58
-
59
-
60
-
61
-
62
-
63
-
64
-
65
-
66
-
67
-
68
-
69
-
70
-
71
-
72
-
73
-
74
-
75
-
76
-
77
-
78
-
79
-
80
-
81
-
82
-
83
-
84
-
85
-
86
-
87
-
88
-
89
-
90
-
91
-
92
-
93
-
94
-
95
-
96
 |
 |
SAFEWAY INC. AND SUBSIDIARIES
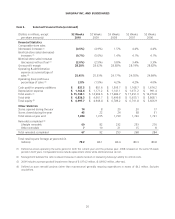
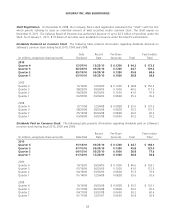
The gross profit margin decreased 34 basis points to 28.28% of sales in 2010 from 28.62% of sales in 2009. The impact
from fuel sales decreased gross profit margin 27 basis points. The remaining seven basis-point decline was largely the
result of investments in price, partly offset by improvements in shrink.
The gross profit margin increased 24 basis points to 28.62% of sales in 2009 from 28.38% of sales in 2008. The impact
from fuel sales increased gross profit margin 59 basis points. The offsetting 35 basis-point decline was largely the result of
investments in everyday prices and higher advertising expense, partly offset by lower LIFO expense, higher gift card
revenue and higher energy costs. LIFO income was $35.2 million in 2009 compared to expense of $34.9 million in 2008.
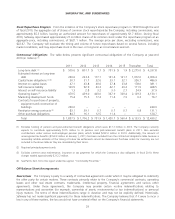
Operating and Administrative Expense Operating and administrative expense consists primarily of store occupancy
costs and backstage expenses, which, in turn, consist primarily of wages, employee benefits, rent, depreciation and
utilities.
Operating and administrative expense was 25.45% of sales in 2010 compared to 25.33% of sales in 2009 and 24.17%
in 2008.
Operating and administrative expense margin increased 12 basis points to 25.45% of sales in 2010 from 25.33% of sales
in 2009. Higher fuel sales in 2010 decreased operating and administrative expense margin by 31 basis points. The
offsetting 43-basis-point increase was primarily the result of higher labor costs, partly offset by a net gain on property
dispositions.
Operating and administrative expense margin increased 116 basis points to 25.33% of sales in 2009 from 24.17% of
sales in 2008. Lower fuel sales in 2009 increased operating and administrative expense margin 56 basis points. The
remaining 60 basis points was primarily the result of decreased sales leverage, increased charges from property
impairments and dispositions and increased pension expense, partly offset by lower workers’ compensation expense and
energy costs.
Gain (Loss) on Property Dispositions Operating and administrative expense included a net gain on property dispositions
of $27.5 million in 2010, a net loss of $12.7 million in 2009 and a net gain of $19.0 million in 2008.
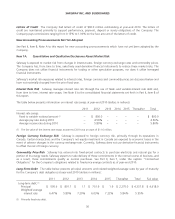
Interest Expense Interest expense was $298.5 million in 2010, compared to $331.7 million in 2009 and $358.7 million
in 2008. Interest expense decreased in 2010 and 2009 primarily due to a combination of lower average borrowings and a
lower average interest rate.
Other Income Other income consists primarily of interest income and equity in earnings (losses) from Safeway’s
unconsolidated affiliate. Interest income was $4.4 million in 2010, $2.3 million in 2009 and $12.5 million in 2008. Equity
in earnings (losses) of unconsolidated affiliate was income of $15.3 million in 2010, income of $8.5 million in 2009 and a
loss of $2.5 million in 2008.
Income Taxes Income taxes were $290.6 million, or 33.0% of pre-tax income, in 2010. In 2009, Safeway had income
tax expense of $144.2 million despite having a pre-tax loss of $953.3 million. The 2009 tax expense reflects the tax effect
of the goodwill impairment charge which is largely nondeductible for income tax purposes and, therefore, increases the
Company’s effective income tax rate. The impact of the goodwill impairment charge on the tax expense was partly offset
by a benefit of $74.9 million from the favorable resolution of various tax matters. The effective tax rate for 2008 was
35.8%.
Critical Accounting Policies and Estimates
Critical accounting policies are those accounting policies that management believes are important to the portrayal of
Safeway’s financial condition and results of operations and require management’s most difficult, subjective or complex
judgments, often as a result of the need to make estimates about the effect of matters that are inherently uncertain.
22