Safeway 2010 Annual Report Download - page 81
Download and view the complete annual report
Please find page 81 of the 2010 Safeway annual report below. You can navigate through the pages in the report by either clicking on the pages listed below, or by using the keyword search tool below to find specific information within the annual report.-
 1
1 -
2
-
3
-
4
-
5
-
6
-
7
-
8
-
9
-
10
-
11
-
12
-
13
-
14
-
15
-
16
-
17
-
18
-
19
-
20
-
21
-
22
-
23
-
24
-
25
-
26
-
27
-
28
-
29
-
30
-
31
-
32
-
33
-
34
-
35
-
36
-
37
-
38
-
39
-
40
-
41
-
42
-
43
-
44
-
45
-
46
-
47
-
48
-
49
-
50
-
51
-
52
-
53
-
54
-
55
-
56
-
57
-
58
-
59
-
60
-
61
-
62
-
63
-
64
-
65
-
66
-
67
-
68
-
69
-
70
-
 71
71 -
 72
72 -
 73
73 -
 74
74 -
 75
75 -
 76
76 -
 77
77 -
 78
78 -
 79
79 -
 80
80 -
 81
81 -
 82
82 -
 83
83 -
 84
84 -
 85
85 -
 86
86 -
 87
87 -
 88
88 -
 89
89 -
 90
90 -
 91
91 -
92
-
93
-
94
-
95
-
96
 |
 |

SAFEWAY INC. AND SUBSIDIARIES
Notes to Consolidated Financial Statements
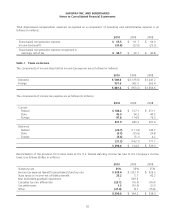
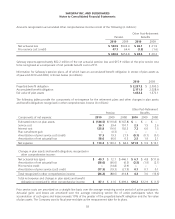
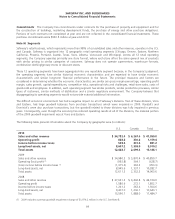
The following table presents sales revenue by type of similar product (dollars in millions):
2010 2009 2008
Amount % of total Amount % of total Amount % of total
Non-perishables (1) $17,364.4 42.3% $17,854.4 43.7% $18,666.9 42.4%
Perishables (2) 15,430.8 37.6% 15,328.6 37.5% 16,514.0 37.4%
Pharmacy 3,881.0 9.4% 3,835.3 9.4% 3,878.3 8.8%
Fuel 3,187.9 7.8% 2,688.7 6.6% 3,885.2 8.8%
Other (3) 1,185.9 2.9% 1,143.7 2.8% 1,159.6 2.6%
Total sales and other revenue $41,050.0 100.0% $40,850.7 100.0% $44,104.0 100.0%
(1) Consists primarily of grocery, soft drinks and other beverages, general merchandise, meal ingredients, frozen foods and snacks.
(2) Consists primarily of produce, meat, dairy, bakery, deli, floral and seafood.
(3) Consists primarily of wholesale sales and other revenue.
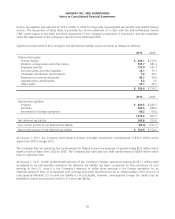
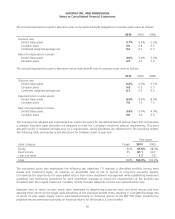
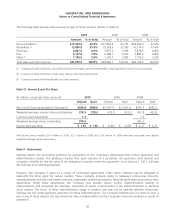
Note O: Income (Loss) Per Share
(In millions, except per-share amounts) 2010 2009 2008
Diluted Basic Diluted Basic Diluted Basic
Net income (loss) attributable to Safeway Inc. $589.8 $589.8 $(1,097.5) $(1,097.5) $965.3 $965.3
Weighted-average common shares outstanding 378.3 378.3 412.9 412.9 433.8 433.8
Common share equivalents 1.3 2.5
Weighted-average shares outstanding 379.6 436.3
Income (loss) per share $ 1.55 $ 1.56 $ (2.66) $ (2.66) $ 2.21 $ 2.23
Anti-dilutive shares totaling 26.4 million in 2010, 42.5 million in 2009 and 21.9 million in 2008 have been excluded from diluted
weighted-average shares outstanding.
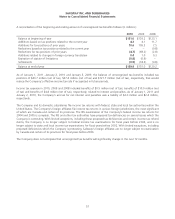
Note P: Guarantees
Safeway applies the accounting guidance for guarantees to the Company’s agreements that contain guarantee and
indemnification clauses. This guidance requires that, upon issuance of a guarantee, the guarantor must disclose and
recognize a liability for the fair value of the obligation it assumes under the guarantee. As of January 1, 2011, Safeway
did not have any material guarantees.
However, the Company is party to a variety of contractual agreements under which Safeway may be obligated to
indemnify the other party for certain matters. These contracts primarily relate to Safeway’s commercial contracts,
operating leases and other real estate contracts, trademarks, intellectual property, financial agreements and various other
agreements. Under these agreements, the Company may provide certain routine indemnifications relating to
representations and warranties (for example, ownership of assets, environmental or tax indemnifications) or personal
injury matters. The terms of these indemnifications range in duration and may not be explicitly defined. Historically,
Safeway has not made significant payments for these indemnifications. The Company believes that if it were to incur a
loss in any of these matters, the loss would not have a material effect on the Company’s financial condition or results of
operations.
65