Safeway 2010 Annual Report Download - page 36
Download and view the complete annual report
Please find page 36 of the 2010 Safeway annual report below. You can navigate through the pages in the report by either clicking on the pages listed below, or by using the keyword search tool below to find specific information within the annual report.-
 1
1 -
2
-
3
-
4
-
5
-
6
-
7
-
8
-
9
-
10
-
11
-
12
-
13
-
14
-
15
-
16
-
17
-
18
-
19
-
20
-
21
-
22
-
23
-
24
-
25
-
 26
26 -
 27
27 -
 28
28 -
 29
29 -
 30
30 -
 31
31 -
 32
32 -
 33
33 -
 34
34 -
 35
35 -
 36
36 -
 37
37 -
 38
38 -
 39
39 -
 40
40 -
 41
41 -
 42
42 -
 43
43 -
 44
44 -
 45
45 -
 46
46 -
47
-
48
-
49
-
50
-
51
-
52
-
53
-
54
-
55
-
56
-
57
-
58
-
59
-
60
-
61
-
62
-
63
-
64
-
65
-
66
-
67
-
68
-
69
-
70
-
71
-
72
-
73
-
74
-
75
-
76
-
77
-
78
-
79
-
80
-
81
-
82
-
83
-
84
-
85
-
86
-
87
-
88
-
89
-
90
-
91
-
92
-
93
-
94
-
95
-
96
 |
 |

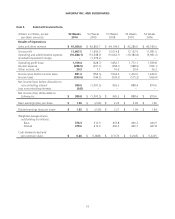
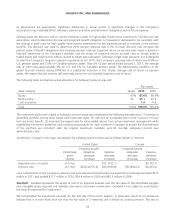
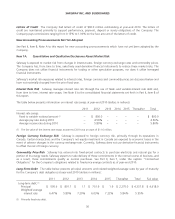
SAFEWAY INC. AND SUBSIDIARIES
Item 6. Selected Financial Data (continued)
(Dollars in millions, except
per-share amounts)
52 Weeks
2010
52 Weeks
2009
53 Weeks
2008
52 Weeks
2007
52 Weeks
2006
Financial Statistics
Comparable-store sales
(decreases) increases (1) (0.5%) (4.9%) 1.5% 4.4% 4.4%
Identical-store sales (decreases)
increases (1) (0.7%) (5.0%) 1.4% 4.1% 4.1%
Identical-store sales increases
(decreases) without fuel (1) (2.0%) (2.5%) 0.8% 3.4% 3.3%
Gross profit margin 28.28% 28.62% 28.38% 28.74% 28.82%
Operating & administrative
expense as a percentage of
sales (2) 25.45% 25.33% 24.17% 24.55% 24.84%
Operating (loss) profit as a
percentage of sales (3) 2.8% (1.5%) 4.2% 4.2% 4.0%
Cash paid for property additions $ 837.5 $ 851.6 $ 1,595.7 $ 1,768.7 $ 1,674.2
Depreciation expense $ 1,162.4 $ 1,171.2 $ 1,141.1 $ 1,071.2 $ 991.4
Total assets (3) $ 15,148.1 $ 14,963.6 $ 17,484.7 $ 17,651.0 $ 16,273.8
Total debt $ 4,836.3 $ 4,901.7 $ 5,499.8 $ 5,655.1 $ 5,868.1
Total equity (3) $ 4,997.7 $ 4,946.4 $ 6,786.2 $ 6,701.8 $ 5,666.9
Other Statistics
Stores opened during the year 14 8202017
Stores closed during the year 45 22 24 38 31
Total stores at year end 1,694 1,725 1,739 1,743 1,761
Remodels completed (4)
Lifestyle remodels 60 82 232 253 276
Other remodels 710 21 15 8
Total remodels completed 67 92 253 268 284
Total retail square footage at year end (in
millions) 79.2 80.1 80.4 80.3 80.8
(1) Defined as stores operating the same period in both the current year and the previous year. 2008 is based on the same 53-week
period in both years. Comparable stores include replacement stores while identical stores do not.
(2) Management believes this ratio is relevant because it assists investors in evaluating Safeway’s ability to control costs.
(3) 2009 includes a pretax goodwill impairment charge of $1,974.2 million, ($1,818.2 million, after-tax).
(4) Defined as store remodel projects (other than maintenance) generally requiring expenditures in excess of $0.2 million. Excludes
acquisitions.
20