Safeway 2010 Annual Report Download - page 55
Download and view the complete annual report
Please find page 55 of the 2010 Safeway annual report below. You can navigate through the pages in the report by either clicking on the pages listed below, or by using the keyword search tool below to find specific information within the annual report.-
 1
1 -
2
-
3
-
4
-
5
-
6
-
7
-
8
-
9
-
10
-
11
-
12
-
13
-
14
-
15
-
16
-
17
-
18
-
19
-
20
-
21
-
22
-
23
-
24
-
25
-
26
-
27
-
28
-
29
-
30
-
31
-
32
-
33
-
34
-
35
-
36
-
37
-
38
-
39
-
40
-
41
-
42
-
43
-
44
-
 45
45 -
 46
46 -
 47
47 -
 48
48 -
 49
49 -
 50
50 -
 51
51 -
 52
52 -
 53
53 -
 54
54 -
 55
55 -
 56
56 -
 57
57 -
 58
58 -
 59
59 -
 60
60 -
 61
61 -
 62
62 -
 63
63 -
 64
64 -
 65
65 -
66
-
67
-
68
-
69
-
70
-
71
-
72
-
73
-
74
-
75
-
76
-
77
-
78
-
79
-
80
-
81
-
82
-
83
-
84
-
85
-
86
-
87
-
88
-
89
-
90
-
91
-
92
-
93
-
94
-
95
-
96
 |
 |

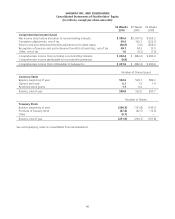
SAFEWAY INC. AND SUBSIDIARIES
Consolidated Statements of Stockholders’ Equity
(In millions, except per-share amounts)
52 Weeks
2010
52 Weeks
2009
53 Weeks
2008
Common Stock
Balance, beginning of year $ 5.9 $ 5.9 $ 5.9
Options exercised 0.1 ––
Balance, end of year 6.0 5.9 5.9
Additional Paid-In Capital
Balance, beginning of year 4,212.4 4,128.3 4,038.2
Share-based employee compensation 55.5 61.7 64.3
Options exercised 105.8 21.5 25.5
Other (10.6) 0.9 0.3
Balance, end of year 4,363.1 4,212.4 4,128.3
Treasury Stock
Balance, beginning of year (5,661.8) (4,776.8) (4,418.0)
Purchase of treasury stock (621.1) (884.9) (359.5)
Options exercised –– 1.1
Other (0.9) (0.1) (0.4)
Balance, end of year (6,283.8) (5,661.8) (4,776.8)
Retained Earnings
Balance, beginning of year 6,403.7 7,657.5 6,829.5
Net income (loss) attributable to Safeway Inc. 589.8 (1,097.5) 965.3
Cash dividends declared ($0.46, $0.3828 and $0.3174 per share) (173.5) (156.3) (137.3)
Balance, end of year 6,820.0 6,403.7 7,657.5
Accumulated Other Comprehensive (Loss) Income
Balance, beginning of year (13.8) (228.7) 246.2
Translation adjustments (net of tax of $3.0, $2.3 and $10.6) 90.6 162.2 (226.7)
Pension and post-retirement benefits adjustment to funded status (net of tax of
$17.5, $0.1 and $165.5) (38.9) (2.0) (266.1)
Recognition of pension and post-retirement benefits actuarial loss (net of tax of
$29.2, $32.8 and $10.9) 49.1 54.9 19.5
Other (net of tax of $0.3, $0.7 and $1.4) 1.0 (0.2) (1.6)
Balance, end of year 88.0 (13.8) (228.7)
Noncontrolling Interests
Balance, beginning of year –––
Adoption of accounting guidance on noncontrolling interests, net of tax 2.8 ––
Net earnings attributable to noncontrolling interests, net of tax 0.8 ––
Other 0.8 ––
Balance, end of year 4.4 ––
Total Equity $ 4,997.7 $ 4,946.4 $ 6,786.2
See accompanying notes to consolidated financial statements.
39