Safeway 2010 Annual Report Download - page 43
Download and view the complete annual report
Please find page 43 of the 2010 Safeway annual report below. You can navigate through the pages in the report by either clicking on the pages listed below, or by using the keyword search tool below to find specific information within the annual report.-
 1
1 -
2
-
3
-
4
-
5
-
6
-
7
-
8
-
9
-
10
-
11
-
12
-
13
-
14
-
15
-
16
-
17
-
18
-
19
-
20
-
21
-
22
-
23
-
24
-
25
-
26
-
27
-
28
-
29
-
30
-
31
-
32
-
 33
33 -
 34
34 -
 35
35 -
 36
36 -
 37
37 -
 38
38 -
 39
39 -
 40
40 -
 41
41 -
 42
42 -
 43
43 -
 44
44 -
 45
45 -
 46
46 -
 47
47 -
 48
48 -
 49
49 -
 50
50 -
 51
51 -
 52
52 -
 53
53 -
54
-
55
-
56
-
57
-
58
-
59
-
60
-
61
-
62
-
63
-
64
-
65
-
66
-
67
-
68
-
69
-
70
-
71
-
72
-
73
-
74
-
75
-
76
-
77
-
78
-
79
-
80
-
81
-
82
-
83
-
84
-
85
-
86
-
87
-
88
-
89
-
90
-
91
-
92
-
93
-
94
-
95
-
96
 |
 |

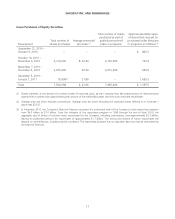
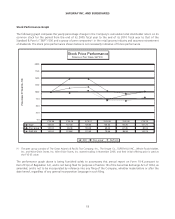
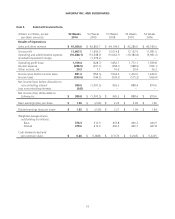
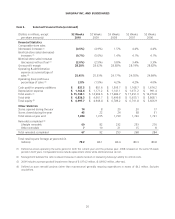
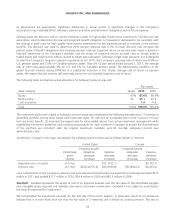
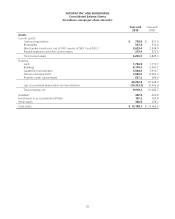
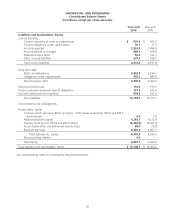
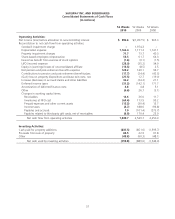
SAFEWAY INC. AND SUBSIDIARIES
Free cash flow provides information regarding the cash that the Company’s business generates, which management
believes is useful to understanding the Company’s business. Free cash flow is also a useful indicator of Safeway’s ability to
service debt and fund share repurchases that management believes will enhance stockholder value.
This non-GAAP financial measure should not be considered as an alternative to net cash flow from operating activities or
other increases and decreases in cash as shown on our Consolidated Statements of Cash Flows as a measure of liquidity.
Non-GAAP financial measures have limitations as analytical tools, and they should not be considered in isolation or as
substitutes for analysis of the Company’s results as reported under GAAP. Other companies in the Company’s industry
may calculate free cash flow differently, limiting its usefulness as a comparative measure. Because of these limitations,
free cash flow should not be considered as a measure of discretionary cash available to us to invest in the growth of our
business.
Income taxes During 2009, the Company received tax refunds of $413 million as follows: (1) the Company accelerated
certain tax deductions for its 2008 income tax returns resulting in approximately $224 million of tax refunds; and (2) the
resolution of certain other income tax matters resulted in tax refunds of approximately $189 million. These tax refunds
increased cash flow from operating activities by $396 million and reduced cash flow used by financing activities by $17
million.
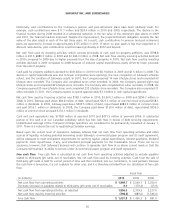
Bank Credit Agreement Information about the Company’s bank credit agreement appears in Note D to the
consolidated financial statements set forth in Part II, Item 8 of this report.
The computation of Adjusted EBITDA, as defined by the credit agreement, is provided below solely to provide an
understanding of the impact that Adjusted EBITDA has on Safeway’s ability to borrow under the credit agreement.
Adjusted EBITDA should not be considered as an alternative to net income or cash flow from operating activities (which
are determined in accordance with GAAP) and is not being presented as an indicator of operating performance or a
measure of liquidity. Other companies may define Adjusted EBITDA differently and, as a result, such measures may not be
comparable to Safeway’s Adjusted EBITDA (dollars in millions).
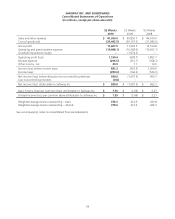
52 weeks
2010
Adjusted EBITDA:
Net income attributable to Safeway Inc. $ 589.8
Add (subtract):
Income taxes 290.6
Interest expense 298.5
Depreciation expense 1,162.4
LIFO income (28.0)
Share-based employee compensation 55.5
Property impairment charges 71.7
Equity in earnings of unconsolidated affiliate (15.3)
Total Adjusted EBITDA $ 2,425.2
Adjusted EBITDA as a multiple of interest expense 8.12x
Minimum Adjusted EBITDA as a multiple of interest expense under bank credit agreement 2.00x
Total debt at year-end 2010 $ 4,836.3
Less cash and equivalents in excess of $75.0 at January 1, 2011 (703.8)
Adjusted Debt $ 4,132.5
Adjusted Debt to Adjusted EBITDA 1.70x
Maximum Adjusted Debt to Adjusted EBITDA under bank credit agreement 3.50x
27