Safeway 2010 Annual Report Download - page 34
Download and view the complete annual report
Please find page 34 of the 2010 Safeway annual report below. You can navigate through the pages in the report by either clicking on the pages listed below, or by using the keyword search tool below to find specific information within the annual report.-
 1
1 -
2
-
3
-
4
-
5
-
6
-
7
-
8
-
9
-
10
-
11
-
12
-
13
-
14
-
15
-
16
-
17
-
18
-
19
-
20
-
21
-
22
-
23
-
 24
24 -
 25
25 -
 26
26 -
 27
27 -
 28
28 -
 29
29 -
 30
30 -
 31
31 -
 32
32 -
 33
33 -
 34
34 -
 35
35 -
 36
36 -
 37
37 -
 38
38 -
 39
39 -
 40
40 -
 41
41 -
 42
42 -
 43
43 -
 44
44 -
45
-
46
-
47
-
48
-
49
-
50
-
51
-
52
-
53
-
54
-
55
-
56
-
57
-
58
-
59
-
60
-
61
-
62
-
63
-
64
-
65
-
66
-
67
-
68
-
69
-
70
-
71
-
72
-
73
-
74
-
75
-
76
-
77
-
78
-
79
-
80
-
81
-
82
-
83
-
84
-
85
-
86
-
87
-
88
-
89
-
90
-
91
-
92
-
93
-
94
-
95
-
96
 |
 |
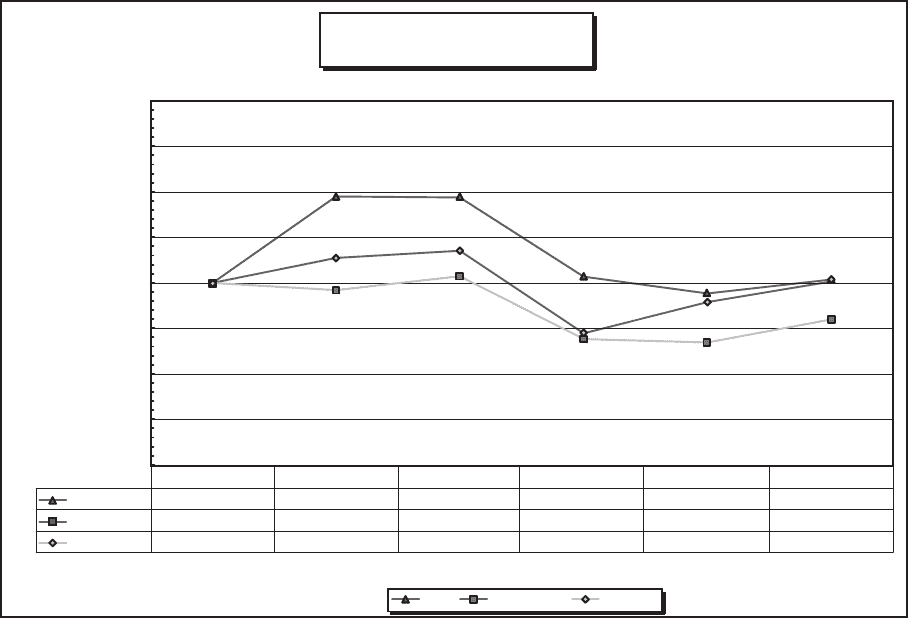
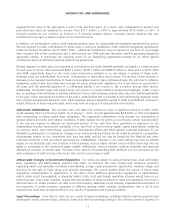
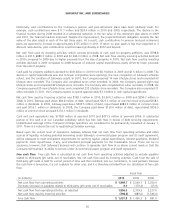
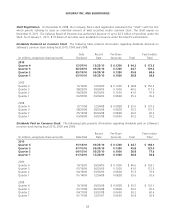
SAFEWAY INC. AND SUBSIDIARIES
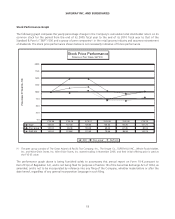
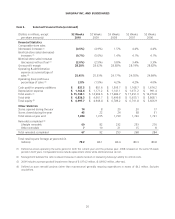
Stock Performance Graph
The following graph compares the yearly percentage change in the Company’s cumulative total stockholder return on its
common stock for the period from the end of its 2005 fiscal year to the end of its 2010 fiscal year to that of the
Standard & Poor’s (“S&P”) 500 and a group of peer companies(*) in the retail grocery industry and assumes reinvestment
of dividends. The stock price performance shown below is not necessarily indicative of future performance.
Stock Price Performance
Safeway vs Peer Group, S&P 500
0.0
25.0
50.0
75.0
100.0
125.0
200.0
175.0
150.0
Price Index FY End 05 = 100
SWY Peer group * S&P 500
SWY
Peer group *
S&P 500
FYE 05 FYE 06 FYE 07 FYE 08 FYE 09 FYE 10
100.00 113.62 117.63 72.36 89.33
100.00 147.22 146.86 103.30 94.26 101.72
100.00 96.08 103.58 69.22 67.35 80.06
100.75
(*) The peer group consists of The Great Atlantic & Pacific Tea Company, Inc., The Kroger Co., SUPERVALU INC., Whole Foods Market,
Inc. and Winn-Dixie Stores, Inc. Winn-Dixie Stores, Inc. started trading in November 2006, and their initial offering price is used as
the FYE 05 value.
The performance graph above is being furnished solely to accompany this annual report on Form 10-K pursuant to
Item 201(e) of Regulation S-K, and is not being filed for purposes of Section 18 of the Securities Exchange Act of 1934, as
amended, and is not to be incorporated by reference into any filing of the Company, whether made before or after the
date hereof, regardless of any general incorporation language in such filing.
18