Safeway 2010 Annual Report Download - page 54
Download and view the complete annual report
Please find page 54 of the 2010 Safeway annual report below. You can navigate through the pages in the report by either clicking on the pages listed below, or by using the keyword search tool below to find specific information within the annual report.-
 1
1 -
2
-
3
-
4
-
5
-
6
-
7
-
8
-
9
-
10
-
11
-
12
-
13
-
14
-
15
-
16
-
17
-
18
-
19
-
20
-
21
-
22
-
23
-
24
-
25
-
26
-
27
-
28
-
29
-
30
-
31
-
32
-
33
-
34
-
35
-
36
-
37
-
38
-
39
-
40
-
41
-
42
-
43
-
 44
44 -
 45
45 -
 46
46 -
 47
47 -
 48
48 -
 49
49 -
 50
50 -
 51
51 -
 52
52 -
 53
53 -
 54
54 -
 55
55 -
 56
56 -
 57
57 -
 58
58 -
 59
59 -
 60
60 -
 61
61 -
 62
62 -
 63
63 -
 64
64 -
65
-
66
-
67
-
68
-
69
-
70
-
71
-
72
-
73
-
74
-
75
-
76
-
77
-
78
-
79
-
80
-
81
-
82
-
83
-
84
-
85
-
86
-
87
-
88
-
89
-
90
-
91
-
92
-
93
-
94
-
95
-
96
 |
 |

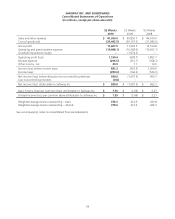
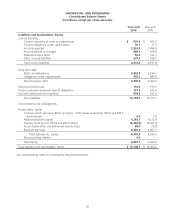
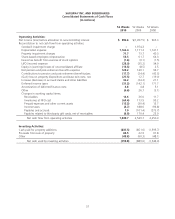
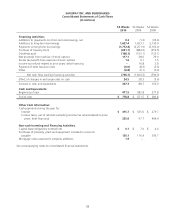
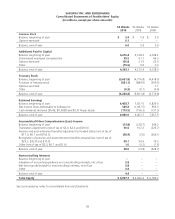
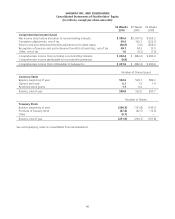
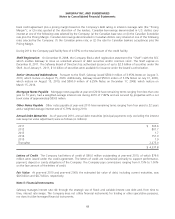
SAFEWAY INC. AND SUBSIDIARIES
Consolidated Statements of Cash Flows
(In millions)
52 Weeks
2010
52 Weeks
2009
53 Weeks
2008
Financing Activities:
Additions to (payments on) short-term borrowings, net 0.2 (1.3) (95.0)
Additions to long-term borrowings 1,627.4 1,653.7 2,130.0
Payments on long-term borrowings (1,712.4) (2,251.9) (2,165.0)
Purchase of treasury stock (621.1) (884.9) (359.5)
Dividends paid (168.1) (153.1) (132.1)
Net proceeds from exercise of stock options 117.1 28.6 29.0
Excess tax benefit from exercise of stock options 1.6 0.1 1.5
Income tax refund related to prior years’ debt financing –16.8 2.8
Payment of debt issuance costs (6.0) (8.2) (5.6)
Other (6.8) (0.1) (0.4)
Net cash flow used by financing activities (768.1) (1,600.3) (594.3)
Effect of changes in exchange rates on cash 24.5 28.3 (5.6)
Increase in cash and equivalents 307.3 88.7 105.0
Cash and Equivalents:
Beginning of year 471.5 382.8 277.8
End of year $ 778.8 $ 471.5 $ 382.8
Other Cash Information:
Cash payments during the year for:
Interest $ 315.7 $ 335.6 $ 379.7
Income taxes, net of refunds (excluding income tax refund related to prior
years’ debt financing) 325.6 97.7 464.4
Non-cash Investing and Financing Activities:
Capital lease obligations entered into $ 0.1 $ 7.0 $ 4.4
Purchases of property, plant and equipment included in accounts
payable 130.1 116.4 243.7
Mortgage notes assumed in property additions 1.9 ––
See accompanying notes to consolidated financial statements.
38