Safeway 2010 Annual Report Download - page 53
Download and view the complete annual report
Please find page 53 of the 2010 Safeway annual report below. You can navigate through the pages in the report by either clicking on the pages listed below, or by using the keyword search tool below to find specific information within the annual report.-
 1
1 -
2
-
3
-
4
-
5
-
6
-
7
-
8
-
9
-
10
-
11
-
12
-
13
-
14
-
15
-
16
-
17
-
18
-
19
-
20
-
21
-
22
-
23
-
24
-
25
-
26
-
27
-
28
-
29
-
30
-
31
-
32
-
33
-
34
-
35
-
36
-
37
-
38
-
39
-
40
-
41
-
42
-
 43
43 -
 44
44 -
 45
45 -
 46
46 -
 47
47 -
 48
48 -
 49
49 -
 50
50 -
 51
51 -
 52
52 -
 53
53 -
 54
54 -
 55
55 -
 56
56 -
 57
57 -
 58
58 -
 59
59 -
 60
60 -
 61
61 -
 62
62 -
 63
63 -
64
-
65
-
66
-
67
-
68
-
69
-
70
-
71
-
72
-
73
-
74
-
75
-
76
-
77
-
78
-
79
-
80
-
81
-
82
-
83
-
84
-
85
-
86
-
87
-
88
-
89
-
90
-
91
-
92
-
93
-
94
-
95
-
96
 |
 |

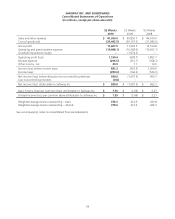
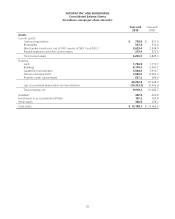
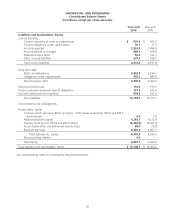
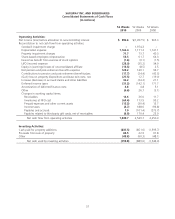
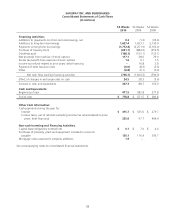
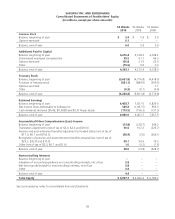
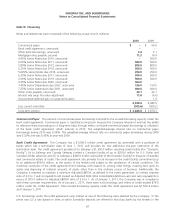
SAFEWAY INC. AND SUBSIDIARIES
Consolidated Statements of Cash Flows
(In millions)
52 Weeks
2010
52 Weeks
2009
53 Weeks
2008
Operating Activities:
Net income (loss) before allocation to noncontrolling interest $ 590.6 $(1,097.5) $ 965.3
Reconciliation to net cash flow from operating activities:
Goodwill impairment charge –1,974.2 –
Depreciation expense 1,162.4 1,171.2 1,141.1
Property impairment charges 71.7 73.7 40.3
Share-based employee compensation 55.5 61.7 64.3
Excess tax benefit from exercise of stock options (1.6) (0.1) (1.5)
LIFO (income) expense (28.0) (35.2) 34.9
Equity in (earnings) losses of unconsolidated affiliate (15.3) (8.5) 2.5
Net pension and post-retirement benefits expense 125.2 140.1 96.7
Contributions to pension and post-retirement benefit plans (17.7) (24.4) (42.5)
(Gain) loss on property dispositions and lease exit costs, net (27.5) 12.7 (19.0)
Increase (decrease) in accrued claims and other liabilities 36.2 (34.3) 21.1
Deferred income taxes (31.3) (142.1) 171.7
Amortization of deferred finance costs 4.8 4.8 5.1
Other (6.6) 26.7 (3.1)
Changes in working capital items:
Receivables 14.6 26.0 11.7
Inventories at FIFO cost (64.4) 173.5 95.2
Prepaid expenses and other current assets (15.3) (30.4) 13.7
Income taxes (3.7) 188.6 (96.8)
Payables and accruals 7.0 (101.4) (273.7)
Payables related to third-party gift cards, net of receivables (6.9) 170.4 23.9
Net cash flow from operating activities 1,849.7 2,549.7 2,250.9
Investing Activities:
Cash paid for property additions (837.5) (851.6) (1,595.7)
Proceeds from sale of property 84.5 22.9 97.8
Other (45.8) (60.3) (48.1)
Net cash used by investing activities (798.8) (889.0) (1,546.0)
37