Safeway 2010 Annual Report Download - page 67
Download and view the complete annual report
Please find page 67 of the 2010 Safeway annual report below. You can navigate through the pages in the report by either clicking on the pages listed below, or by using the keyword search tool below to find specific information within the annual report.-
 1
1 -
2
-
3
-
4
-
5
-
6
-
7
-
8
-
9
-
10
-
11
-
12
-
13
-
14
-
15
-
16
-
17
-
18
-
19
-
20
-
21
-
22
-
23
-
24
-
25
-
26
-
27
-
28
-
29
-
30
-
31
-
32
-
33
-
34
-
35
-
36
-
37
-
38
-
39
-
40
-
41
-
42
-
43
-
44
-
45
-
46
-
47
-
48
-
49
-
50
-
51
-
52
-
53
-
54
-
55
-
56
-
 57
57 -
 58
58 -
 59
59 -
 60
60 -
 61
61 -
 62
62 -
 63
63 -
 64
64 -
 65
65 -
 66
66 -
 67
67 -
 68
68 -
 69
69 -
 70
70 -
 71
71 -
 72
72 -
 73
73 -
 74
74 -
 75
75 -
 76
76 -
 77
77 -
78
-
79
-
80
-
81
-
82
-
83
-
84
-
85
-
86
-
87
-
88
-
89
-
90
-
91
-
92
-
93
-
94
-
95
-
96
 |
 |

SAFEWAY INC. AND SUBSIDIARIES
Notes to Consolidated Financial Statements
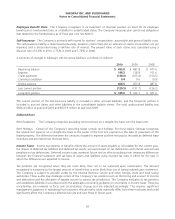
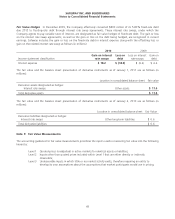
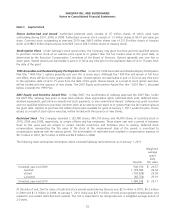
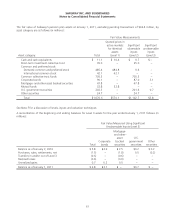
A reconciliation of the beginning and ending balances for Level 3 liabilities for the year ended January 2, 2010 follows (in
millions):
Warrants
Balance as of January 3, 2009 $10.7
Additions 0.4
Unrealized losses, net of gains 4.1
Balance as of January 2, 2010 $15.2
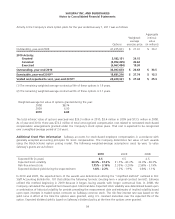
In determining the fair value of assets and liabilities, the Company maximizes the use of quoted market prices and
minimizes the use of unobservable inputs. The Level 1 fair values are based on quoted market values for identical assets.
The fair values of Level 2 assets and liabilities are determined using prices from pricing agencies and financial institutions
that develop values based on observable inputs in active markets. Level 3 fair values are determined from industry
valuation models based on externally developed inputs.
In connection with the Company’s evaluation of long-lived assets for impairment, certain long-lived assets were measured
at fair value on a nonrecurring basis using Level 3 inputs as defined in the fair value hierarchy. Fair value of long-lived
assets is determined by estimating the amount and timing of net future cash flows (including rental expense for leased
properties, sublease rental income, common area maintenance costs and real estate taxes) and discounting them using a
risk-adjusted rate of interest. Safeway estimates future cash flows based on its experience and knowledge of the market
in which the store is located and, when necessary, uses real estate brokers. During fiscal 2010, long-lived assets with a
carrying value of $99.0 million were written down to their fair value of $27.3 million, resulting in an impairment charge
of $71.7 million. During fiscal 2009, long-lived assets with a carrying value of $99.0 million were written down to their
fair value of $25.3 million, resulting in an impairment charge of $73.7 million.
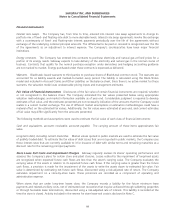
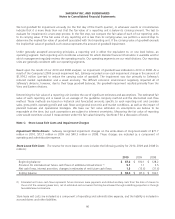
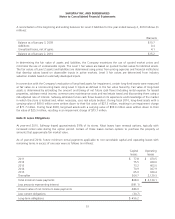
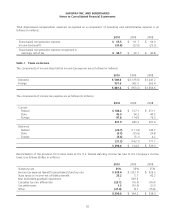
Note G: Lease Obligations
At year-end 2010, Safeway leased approximately 59% of its stores. Most leases have renewal options, typically with
increased rental rates during the option period. Certain of these leases contain options to purchase the property at
amounts that approximate fair market value.
As of year-end 2010, future minimum rental payments applicable to non-cancelable capital and operating leases with
remaining terms in excess of one year were as follows (in millions):
Capital
leases
Operating
leases
2011 $ 77.8 $ 470.5
2012 75.5 439.0
2013 73.2 403.0
2014 70.9 367.9
2015 65.9 320.4
Thereafter 504.7 2,129.3
Total minimum lease payments 868.0 $ 4,130.1
Less amounts representing interest (381.1)
Present value of net minimum lease payments 486.9
Less current obligations (30.7)
Long-term obligations $ 456.2
51