Safeway 2010 Annual Report Download - page 66
Download and view the complete annual report
Please find page 66 of the 2010 Safeway annual report below. You can navigate through the pages in the report by either clicking on the pages listed below, or by using the keyword search tool below to find specific information within the annual report.-
 1
1 -
2
-
3
-
4
-
5
-
6
-
7
-
8
-
9
-
10
-
11
-
12
-
13
-
14
-
15
-
16
-
17
-
18
-
19
-
20
-
21
-
22
-
23
-
24
-
25
-
26
-
27
-
28
-
29
-
30
-
31
-
32
-
33
-
34
-
35
-
36
-
37
-
38
-
39
-
40
-
41
-
42
-
43
-
44
-
45
-
46
-
47
-
48
-
49
-
50
-
51
-
52
-
53
-
54
-
55
-
 56
56 -
 57
57 -
 58
58 -
 59
59 -
 60
60 -
 61
61 -
 62
62 -
 63
63 -
 64
64 -
 65
65 -
 66
66 -
 67
67 -
 68
68 -
 69
69 -
 70
70 -
 71
71 -
 72
72 -
 73
73 -
 74
74 -
 75
75 -
 76
76 -
77
-
78
-
79
-
80
-
81
-
82
-
83
-
84
-
85
-
86
-
87
-
88
-
89
-
90
-
91
-
92
-
93
-
94
-
95
-
96
 |
 |

SAFEWAY INC. AND SUBSIDIARIES
Notes to Consolidated Financial Statements
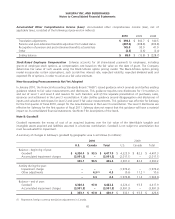
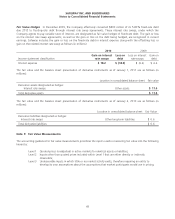
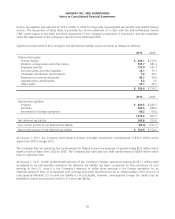
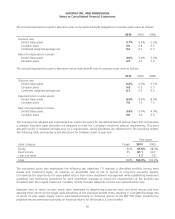
The following table presents assets and liabilities which are measured at fair value on a recurring basis at January 1, 2011
(in millions):
Fair Value Measurements
Assets: Total
Quoted prices in
active markets
for identical
assets
(Level 1)
Significant
observable
inputs
(Level 2)
Significant
unobservable
inputs
(Level 3)
Cash equivalents $ 222.2 $ – $ 222.2 $ –
Short-term investments 159.9 59.8 0.1 –
Non-current investments 229.1 – 29.1 –
Interest rate swap 211.6 – 11.6 –
Total $ 322.8 $ 59.8 $ 263.0 $ –
Liabilities:
Other 3$ 3.0 $ – $ – $ 3.0
Warrants322.8 – – 22.8
Total $ 25.8 $ – $ – $ 25.8
(1) Included in Prepaid Expenses and Other Current Assets on the balance sheet.
(2) Included in Other Assets on the balance sheet.
(3) Included in Accrued Claims and Other Liabilities on the balance sheet.
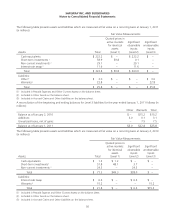
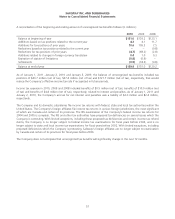
A reconciliation of the beginning and ending balances for Level 3 liabilities for the year ended January 1, 2011 follows (in
millions):
Other Warrants Total
Balance as of January 2, 2010 $ – $15.2 $15.2
Additions 3.0 0.1 3.1
Unrealized losses, net of gains – 7.5 7.5
Balance as of January 1, 2011 $3.0 $22.8 $25.8
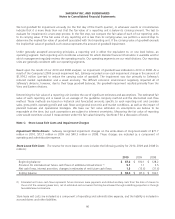
The following table presents assets and liabilities which are measured at fair value on a recurring basis at January 2, 2010
(in millions):
Fair Value Measurements
Assets: Total
Quoted prices in
active markets
for identical
assets
(Level 1)
Significant
observable
inputs
(Level 2)
Significant
unobservable
inputs
(Level 3)
Cash equivalents $ 1.2 $ 1.2 $ – $ –
Short-term investments151.8 48.1 3.7 –
Non-current investments 224.3 – 24.3 –
Total $ 77.3 $49.3 $28.0 $ –
Liabilities:
Interest rate swap $ 6.6 $ – $ 6.6 $ –
Warrants 315.2 – – 15.2
Total $ 21.8 $ – $ 6.6 $15.2
(1) Included in Prepaid Expense and Other Current Assets on the balance sheet.
(2) Included in Other Assets on the balance sheet.
(3) Included in Accrued Claims and Other Liabilities on the balance sheet.
50