Safeway 2010 Annual Report Download - page 23
Download and view the complete annual report
Please find page 23 of the 2010 Safeway annual report below. You can navigate through the pages in the report by either clicking on the pages listed below, or by using the keyword search tool below to find specific information within the annual report.-
 1
1 -
2
-
3
-
4
-
5
-
6
-
7
-
8
-
9
-
10
-
11
-
12
-
 13
13 -
 14
14 -
 15
15 -
 16
16 -
 17
17 -
 18
18 -
 19
19 -
 20
20 -
 21
21 -
 22
22 -
 23
23 -
 24
24 -
 25
25 -
 26
26 -
 27
27 -
 28
28 -
 29
29 -
 30
30 -
 31
31 -
 32
32 -
 33
33 -
34
-
35
-
36
-
37
-
38
-
39
-
40
-
41
-
42
-
43
-
44
-
45
-
46
-
47
-
48
-
49
-
50
-
51
-
52
-
53
-
54
-
55
-
56
-
57
-
58
-
59
-
60
-
61
-
62
-
63
-
64
-
65
-
66
-
67
-
68
-
69
-
70
-
71
-
72
-
73
-
74
-
75
-
76
-
77
-
78
-
79
-
80
-
81
-
82
-
83
-
84
-
85
-
86
-
87
-
88
-
89
-
90
-
91
-
92
-
93
-
94
-
95
-
96
 |
 |

SAFEWAY INC. AND SUBSIDIARIES
In addition, the Company operates laboratory facilities for quality assurance and research and development in certain
plants and at its corporate offices.
Distribution Safeway has 17 distribution/warehousing centers (13 in the United States and four in Canada), which
collectively provide the majority of all products to Safeway’s 12 retail operating areas. The Company’s distribution centers
in Maryland and British Columbia are operated by third parties.
Capital Expenditure Program A key component of the Company’s long-term growth strategy is its capital
expenditure program. The Company’s capital expenditure program funds, among other things, new stores, remodels,
retail shopping center development, manufacturing plants, distribution facilities and information technology. Safeway’s
management has maintained a rigorous program to select and approve new capital investments.
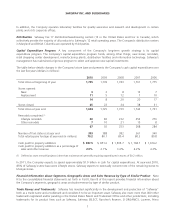
The table below details changes in the Company’s store base and presents the Company’s cash capital expenditures over
the last five years (dollars in millions):
2010 2009 2008 2007 2006
Total stores at beginning of year 1,725 1,739 1,743 1,761 1,775
Stores opened:
New 33 8 13 7
Replacement 11 512 710
14 8202017
Stores closed 45 22 24 38 31
Total stores at year end 1,694 1,725 1,739 1,743 1,761
Remodels completed (1)
Lifestyle remodels 60 82 232 253 276
Other remodels 710 21 15 8
67 92 253 268 284
Number of fuel stations at year end 393 388 382 361 340
Total retail square footage at year end (in millions) 79.2 80.1 80.4 80.3 80.8
Cash paid for property additions $ 837.5 $ 851.6 $ 1,595.7 $ 1,768.7 $ 1,674.2
Cash paid for property additions as a percentage of
sales and other revenue 2.0% 2.1% 3.6% 4.2% 4.2%
(1) Defined as store remodel projects (other than maintenance) generally requiring expenditures in excess of $0.2 million.
In 2011, the Company expects to spend approximately $1.0 billion in cash for capital expenditures. At year-end 2010,
85% of Safeway’s store base were Lifestyle stores. Safeway expects to eventually convert most of the remaining stores to
Lifestyle stores.
Financial Information about Segments, Geographic Areas and Sales Revenue by Type of Similar Product Note
N to the consolidated financial statements set forth in Part II, Item 8 of this report provides financial information about
the Company’s segments, geographic areas and sales revenue by type of similar product.
Trade Names and Trademarks Safeway has invested significantly in the development and protection of “Safeway”
both as a trade name and a trademark and considers it to be an important asset. Safeway also owns more than 400 other
trademarks registered and/or pending in the United States Patent and Trademark Office and other jurisdictions, including
trademarks for its product lines such as Safeway, Safeway SELECT, Rancher’s Reserve, OORGANICS, Lucerne, Primo
7