Safeway 2010 Annual Report Download - page 62
Download and view the complete annual report
Please find page 62 of the 2010 Safeway annual report below. You can navigate through the pages in the report by either clicking on the pages listed below, or by using the keyword search tool below to find specific information within the annual report.-
 1
1 -
2
-
3
-
4
-
5
-
6
-
7
-
8
-
9
-
10
-
11
-
12
-
13
-
14
-
15
-
16
-
17
-
18
-
19
-
20
-
21
-
22
-
23
-
24
-
25
-
26
-
27
-
28
-
29
-
30
-
31
-
32
-
33
-
34
-
35
-
36
-
37
-
38
-
39
-
40
-
41
-
42
-
43
-
44
-
45
-
46
-
47
-
48
-
49
-
50
-
51
-
 52
52 -
 53
53 -
 54
54 -
 55
55 -
 56
56 -
 57
57 -
 58
58 -
 59
59 -
 60
60 -
 61
61 -
 62
62 -
 63
63 -
 64
64 -
 65
65 -
 66
66 -
 67
67 -
 68
68 -
 69
69 -
 70
70 -
 71
71 -
 72
72 -
73
-
74
-
75
-
76
-
77
-
78
-
79
-
80
-
81
-
82
-
83
-
84
-
85
-
86
-
87
-
88
-
89
-
90
-
91
-
92
-
93
-
94
-
95
-
96
 |
 |

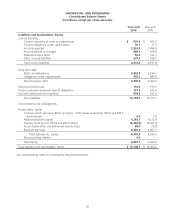
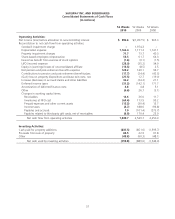
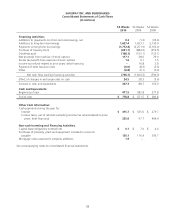
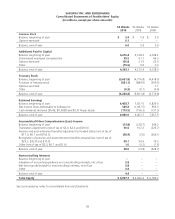
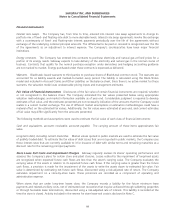
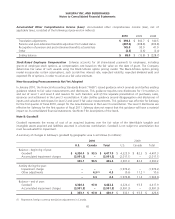
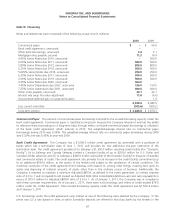
SAFEWAY INC. AND SUBSIDIARIES
Notes to Consolidated Financial Statements
We test goodwill for impairment annually (on the first day of the fourth quarter), or whenever events or circumstances
indicate that it is more likely than not that the fair value of a reporting unit is below its carrying amount. The test to
evaluate for impairment is a two-step process. In the first step, we compare the fair value of each of our reporting units
to its carrying value. If the fair value of any reporting unit is less than its carrying value, we perform a second step to
determine the implied fair value of goodwill associated with that reporting unit. If the carrying value of goodwill exceeds
the implied fair value of goodwill, such excess represents the amount of goodwill impairment.
Under generally accepted accounting principles, a reporting unit is either the equivalent to, or one level below, an
operating segment. Each reporting unit constitutes a business for which discrete financial information is available and for
which management regularly reviews the operating results. Our operating segments are our retail divisions. Our reporting
units are generally consistent with our operating segments.
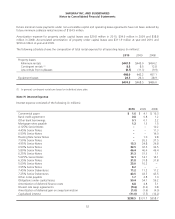
Based upon the results of our 2010 and 2008 analyses, no impairment of goodwill was indicated in 2010 or 2008. As a
result of the Company’s 2009 annual impairment test, Safeway recorded a non-cash impairment charge in the amount of
$1,974.2 million (pre-tax) to reduce the carrying value of goodwill. The impairment was due primarily to Safeway’s
reduced market capitalization and a weak economy. The difficult economic environment negatively impacted all of
Safeway’s divisions; however, due to their large goodwill balances, the goodwill impairment resulted primarily from the
Vons and Eastern divisions.
Determining the fair value of a reporting unit involves the use of significant estimates and assumptions. The estimated fair
value of each reporting unit is based on an average of the guideline company method and the discounted cash flow
method. These methods are based on historical and forecasted amounts specific to each reporting unit and consider
sales, gross profit, operating profit and cash flows and general economic and market conditions, as well as the impact of
planned business and operational strategies. We base our fair value estimates on assumptions we believe to be
reasonable at the time, but such assumptions are subject to inherent uncertainty. Measuring the fair value of reporting
units would constitute a Level 3 measurement under the fair value hierarchy. See Note F for a discussion of levels.
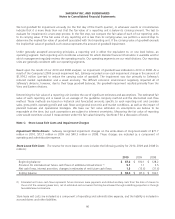
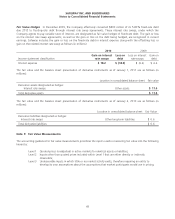
Note C: Store Lease Exit Costs and Impairment Charges
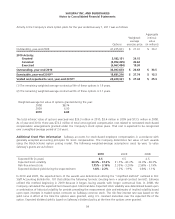
Impairment Write-Downs Safeway recognized impairment charges on the write-down of long-lived assets of $71.7
million in 2010, $73.7 million in 2009 and $40.3 million in 2008. These charges are included as a component of
operating and administrative expense.
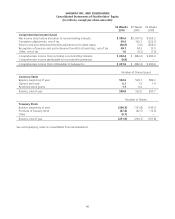
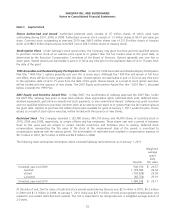
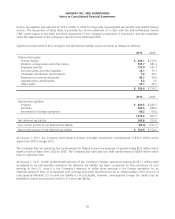
Store Lease Exit Costs The reserve for store lease exit costs includes the following activity for 2010, 2009 and 2008 (in
millions):
2010 2009 2008
Beginning balance $ 87.6 $ 100.1 $ 128.2
Provision for estimated net future cash flows of additional closed stores (1) 5.1 1.1 3.5
Net cash flows, interest accretion, changes in estimates of net future cash flows 1.3 (13.6) (31.6)
Ending balance $ 94.0 $ 87.6 $ 100.1
(1) Estimated net future cash flows represents future minimum lease payments and related ancillary costs from the date of closure to
the end of the remaining lease term, net of estimated cost recoveries that may be achieved through subletting properties or through
favorable lease terminations.
Store lease exit costs are included as a component of operating and administrative expense, and the liability is included in
accrued claims and other liabilities.
46