Safeway 2010 Annual Report Download - page 37
Download and view the complete annual report
Please find page 37 of the 2010 Safeway annual report below. You can navigate through the pages in the report by either clicking on the pages listed below, or by using the keyword search tool below to find specific information within the annual report.-
 1
1 -
2
-
3
-
4
-
5
-
6
-
7
-
8
-
9
-
10
-
11
-
12
-
13
-
14
-
15
-
16
-
17
-
18
-
19
-
20
-
21
-
22
-
23
-
24
-
25
-
26
-
 27
27 -
 28
28 -
 29
29 -
 30
30 -
 31
31 -
 32
32 -
 33
33 -
 34
34 -
 35
35 -
 36
36 -
 37
37 -
 38
38 -
 39
39 -
 40
40 -
 41
41 -
 42
42 -
 43
43 -
 44
44 -
 45
45 -
 46
46 -
 47
47 -
48
-
49
-
50
-
51
-
52
-
53
-
54
-
55
-
56
-
57
-
58
-
59
-
60
-
61
-
62
-
63
-
64
-
65
-
66
-
67
-
68
-
69
-
70
-
71
-
72
-
73
-
74
-
75
-
76
-
77
-
78
-
79
-
80
-
81
-
82
-
83
-
84
-
85
-
86
-
87
-
88
-
89
-
90
-
91
-
92
-
93
-
94
-
95
-
96
 |
 |

SAFEWAY INC. AND SUBSIDIARIES
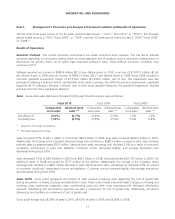
Item 7. Management’s Discussion and Analysis of Financial Condition and Results of Operations
The last three fiscal years consist of the 52-week period ended January 1, 2011 (“fiscal 2010” or “2010”), the 52-week
period ended January 2, 2010 (“fiscal 2009” or “2009”) and the 53-week period ended January 3, 2009 (“fiscal 2008”
or “2008”).
Results of Operations
Economic Outlook The current economic environment has made consumers more cautious. This has led to reduced
consumer spending, to consumers trading down to a less expensive mix of products and to consumers trading down to
discounters for grocery items, all of which have impacted Safeway’s sales. These difficult economic conditions may
continue in 2011.
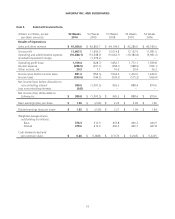
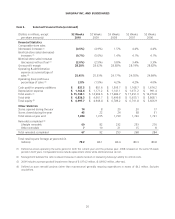
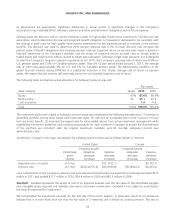
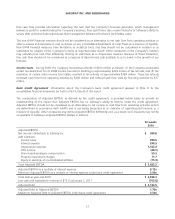
Safeway reported net income of $589.8 million ($1.55 per diluted share) in 2010, a net loss of $1,097.5 million ($2.66
per diluted share) in 2009 and net income of $965.3 million ($2.21 per diluted share) in 2008. Fiscal 2009 included a
non-cash goodwill impairment charge of $1,974.2 million ($1,818.2 million, net of tax). The impairment was due
primarily to Safeway’s reduced market capitalization and a weak economy. The difficult economic environment negatively
impacted all of Safeway’s divisions; however, due to their large goodwill balances, the goodwill impairment resulted
primarily from the Vons and Eastern divisions.
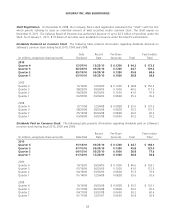
Sales Same-store sales (decreases) increases for the past three fiscal years were as follows:
Fiscal 2010 Fiscal 2009 Fiscal 2008 *
Comparable-
store sales
Identical-store
sales **
Comparable-
store sales
Identical-store
sales **
Comparable-
store sales
Identical-store
sales **
Including fuel (0.5%) (0.7%) (4.9%) (5.0%) 1.5% 1.4%
Excluding fuel (1.8%) (2.0%) (2.5%) (2.5%) 0.9% 0.8%
* Based on a 53-week comparison.
** Excludes replacement stores.
Sales increased 0.5% to $41.1 billion in 2010 from $40.9 billion in 2009. Fuel sales increased $499.2 million in 2010.
Additionally, the change in the Canadian dollar exchange rate resulted in a $588.1 million increase in sales. Store closures
reduced sales by approximately $230 million. Identical-store sales, excluding fuel, declined 2.0% as a result of economic
conditions, investments in price and deflation. Customer counts decreased slightly, and average transaction size
decreased during fiscal 2010.
Sales decreased 7.4% to $40.9 billion in 2009 from $44.1 billion in 2008. Fuel sales declined $1,197 million in 2009. The
additional week in 2008 accounted for $777 million of the decline. Additionally, the change in the Canadian dollar
exchange rate resulted in a $407 million decrease in sales. Identical-store sales, excluding fuel, declined 2.5% as a result
of economic conditions, investments in price and deflation. Customer counts increased slightly, and average transaction
size decreased during fiscal 2009.
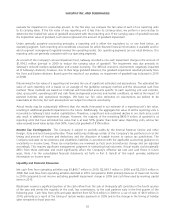
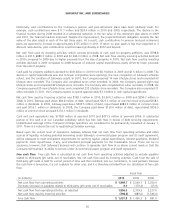
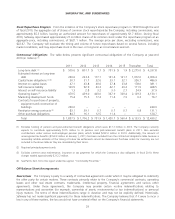
Gross Profit Gross profit represents the portion of sales revenue remaining after deducting the cost of goods sold
during the period, including purchase and distribution costs. These costs include inbound freight charges, purchasing and
receiving costs, warehouse inspection costs, warehousing costs and other costs associated with Safeway’s distribution
network. Advertising and promotional expenses are also a component of cost of goods sold. Additionally, all vendor
allowances are classified as an element of cost of goods sold.
Gross profit margin was 28.28% of sales in 2010, 28.62% of sales in 2009 and 28.38% in 2008.
21