Safeway 2010 Annual Report Download - page 51
Download and view the complete annual report
Please find page 51 of the 2010 Safeway annual report below. You can navigate through the pages in the report by either clicking on the pages listed below, or by using the keyword search tool below to find specific information within the annual report.-
 1
1 -
2
-
3
-
4
-
5
-
6
-
7
-
8
-
9
-
10
-
11
-
12
-
13
-
14
-
15
-
16
-
17
-
18
-
19
-
20
-
21
-
22
-
23
-
24
-
25
-
26
-
27
-
28
-
29
-
30
-
31
-
32
-
33
-
34
-
35
-
36
-
37
-
38
-
39
-
40
-
 41
41 -
 42
42 -
 43
43 -
 44
44 -
 45
45 -
 46
46 -
 47
47 -
 48
48 -
 49
49 -
 50
50 -
 51
51 -
 52
52 -
 53
53 -
 54
54 -
 55
55 -
 56
56 -
 57
57 -
 58
58 -
 59
59 -
 60
60 -
 61
61 -
62
-
63
-
64
-
65
-
66
-
67
-
68
-
69
-
70
-
71
-
72
-
73
-
74
-
75
-
76
-
77
-
78
-
79
-
80
-
81
-
82
-
83
-
84
-
85
-
86
-
87
-
88
-
89
-
90
-
91
-
92
-
93
-
94
-
95
-
96
 |
 |

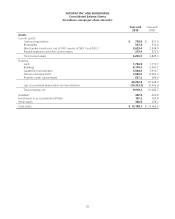
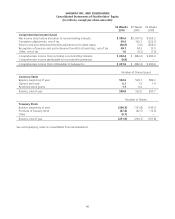
SAFEWAY INC. AND SUBSIDIARIES
Consolidated Balance Sheets
(In millions, except per-share amounts)
Year-end
2010
Year-end
2009
Assets
Current assets:
Cash and equivalents $ 778.8 $ 471.5
Receivables 557.4 522.4
Merchandise inventories, net of LIFO reserve of $35.1 and $63.1 2,623.4 2,508.9
Prepaid expenses and other current assets 273.4 322.5
Total current assets 4,233.0 3,825.3
Property:
Land 1,796.8 1,717.7
Buildings 6,170.5 5,900.7
Leasehold improvements 3,934.9 3,916.7
Fixtures and equipment 7,694.0 8,063.0
Property under capital leases 637.2 649.9
20,233.4 20,248.0
Less accumulated depreciation and amortization (10,323.2) (9,965.3)
Total property, net 9,910.2 10,282.7
Goodwill 430.9 426.6
Investments in unconsolidated affiliate 187.2 169.9
Other assets 386.8 259.1
Total assets $ 15,148.1 $ 14,963.6
35