Safeway 2010 Annual Report Download - page 70
Download and view the complete annual report
Please find page 70 of the 2010 Safeway annual report below. You can navigate through the pages in the report by either clicking on the pages listed below, or by using the keyword search tool below to find specific information within the annual report.-
 1
1 -
2
-
3
-
4
-
5
-
6
-
7
-
8
-
9
-
10
-
11
-
12
-
13
-
14
-
15
-
16
-
17
-
18
-
19
-
20
-
21
-
22
-
23
-
24
-
25
-
26
-
27
-
28
-
29
-
30
-
31
-
32
-
33
-
34
-
35
-
36
-
37
-
38
-
39
-
40
-
41
-
42
-
43
-
44
-
45
-
46
-
47
-
48
-
49
-
50
-
51
-
52
-
53
-
54
-
55
-
56
-
57
-
58
-
59
-
 60
60 -
 61
61 -
 62
62 -
 63
63 -
 64
64 -
 65
65 -
 66
66 -
 67
67 -
 68
68 -
 69
69 -
 70
70 -
 71
71 -
 72
72 -
 73
73 -
 74
74 -
 75
75 -
 76
76 -
 77
77 -
 78
78 -
 79
79 -
 80
80 -
81
-
82
-
83
-
84
-
85
-
86
-
87
-
88
-
89
-
90
-
91
-
92
-
93
-
94
-
95
-
96
 |
 |

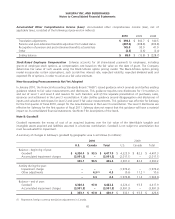
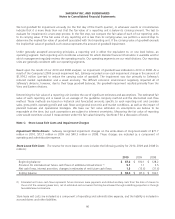
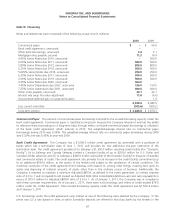
SAFEWAY INC. AND SUBSIDIARIES
Notes to Consolidated Financial Statements
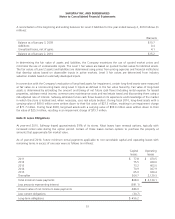
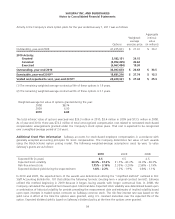
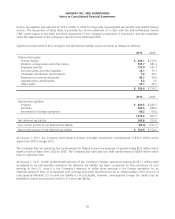
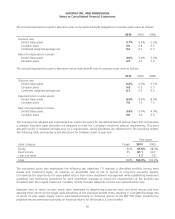
Activity in the Company’s stock option plans for the year ended January 1, 2011 was as follows:
Options
Weighted-
average
exercise price
Aggregate
intrinsic
value
(in millions)
Outstanding, year-end 2009 41,235,601 $ 27.41 $ 36.2
2010 Activity:
Granted 3,182,151 24.15
Canceled (4,952,425) 40.62
Exercised (6,067,454) 19.30
Outstanding, year-end 2010 33,397,873 $ 26.63 $ 33.5
Exercisable, year-end 2010(1) 18,681,216 $ 27.74 $ 13.3
Vested and expected to vest, year-end 2010(2) 28,229,361 $ 27.04 $ 25.3
(1) The remaining weighted-average contractual life of these options is 1.9 years.
(2) The remaining weighted-average contractual life of these options is 3.1 years.
Weighted-average fair value of options granted during the year:
2008 $8.74
2009 6.90
2010 6.88
The total intrinsic value of options exercised was $26.3 million in 2010, $3.4 million in 2009 and $13.5 million in 2008.
As of year-end 2010, there was $74.2 million of total unrecognized compensation cost related to nonvested stock-based
compensation arrangements granted under the Company’s stock option plans. That cost is expected to be recognized
over a weighted average period of 2.6 years.
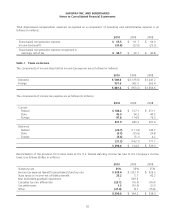
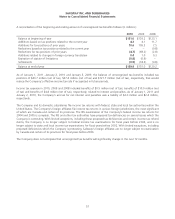
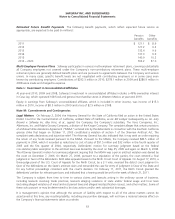
Additional Stock Plan Information Safeway accounts for stock-based employee compensation in accordance with
generally accepted accounting principles for stock compensation. The Company determines fair value of such awards
using the Black-Scholes option pricing model. The following weighted-average assumptions used, by year, to value
Safeway’s grants are as follows:
2010 2009 2008
Expected life (in years) 6.5 6.5 4.5
Expected stock volatility 30.3% - 31.2% 31.5% - 40.2% 32.0% - 48.3%
Risk-free interest rate 1.75% - 3.10% 2.35% - 3.20% 2.58% - 3.19%
Expected dividend yield during the expected term 1.8% - 2.2% 1.3% - 1.9% 0.8% - 1.1%
In 2010 and 2009, the expected term of the awards was determined utilizing the “simplified method” outlined in SEC
Staff Accounting Bulletin No. 107 that utilizes the following formula: ((vesting term + original contract term)/2). Safeway
utilized this method beginning in 2009 because it began issuing awards with longer contractual lives. In 2008, the
Company calculated the expected term based upon historical data. Expected stock volatility was determined based upon
a combination of historical volatility for periods preceding the measurement date and estimates of implied volatility based
upon open interests in traded option contracts on Safeway common stock. The risk-free interest rate was based on the
yield curve in effect at the time the options were granted, using U.S. constant maturities over the expected life of the
option. Expected dividend yield is based on Safeway’s dividend policy at the time the options were granted.
54