Safeway 2010 Annual Report Download - page 42
Download and view the complete annual report
Please find page 42 of the 2010 Safeway annual report below. You can navigate through the pages in the report by either clicking on the pages listed below, or by using the keyword search tool below to find specific information within the annual report.-
 1
1 -
2
-
3
-
4
-
5
-
6
-
7
-
8
-
9
-
10
-
11
-
12
-
13
-
14
-
15
-
16
-
17
-
18
-
19
-
20
-
21
-
22
-
23
-
24
-
25
-
26
-
27
-
28
-
29
-
30
-
31
-
 32
32 -
 33
33 -
 34
34 -
 35
35 -
 36
36 -
 37
37 -
 38
38 -
 39
39 -
 40
40 -
 41
41 -
 42
42 -
 43
43 -
 44
44 -
 45
45 -
 46
46 -
 47
47 -
 48
48 -
 49
49 -
 50
50 -
 51
51 -
 52
52 -
53
-
54
-
55
-
56
-
57
-
58
-
59
-
60
-
61
-
62
-
63
-
64
-
65
-
66
-
67
-
68
-
69
-
70
-
71
-
72
-
73
-
74
-
75
-
76
-
77
-
78
-
79
-
80
-
81
-
82
-
83
-
84
-
85
-
86
-
87
-
88
-
89
-
90
-
91
-
92
-
93
-
94
-
95
-
96
 |
 |

SAFEWAY INC. AND SUBSIDIARIES
Historically, cash contributions to the Company’s pension and post-retirement plans have been relatively small. For
example, cash contributions were $17.7 million and $24.4 million in 2010 and 2009, respectively. The decline in the
financial markets during 2008 resulted in a substantial reduction in the fair value of the retirement plan assets. In 2009
and 2010, the financial markets improved. Despite the improvement, the projected benefit obligation exceeds the fair
value of the plan assets in each of the last three years. As a result, cash contributions to pension and post-retirement
plans are expected to increase to approximately $175 million in 2011. If return on plan assets is less than expected or if
discount rates decline, plan contributions could increase significantly in 2012 and beyond.
Net cash flow used by investing activities, which consists principally of cash paid for property additions, was $798.8
million in 2010, $889.0 million in 2009 and $1,546.0 million in 2008. Net cash flow used by investing activities declined
in 2010 compared to 2009 due to higher proceeds from the sale of property in 2010. Net cash flow used by investing
activities declined in 2009 compared to 2008 because of reduced capital expenditures, partly offset by lower proceeds
from the sale of property.
Cash paid for property additions declined to $0.8 billion in 2010 from $0.9 billion in 2009 and $1.6 billion in 2008. The
decline in capital expenditures was due to fewer competitive store openings, the near-completion of Safeway’s Lifestyle
rollout, and the condition of Safeway’s assets. In 2010, the Company opened 14 new Lifestyle stores and completed 60
Lifestyle store remodels. The Company also completed seven other remodels. In 2009, the Company opened eight new
Lifestyle stores and completed 82 Lifestyle store remodels. The Company also completed ten other remodels. In 2008, the
Company opened 20 new Lifestyle stores and completed 232 Lifestyle store remodels. The Company also completed 21
other remodels. In 2011, the Company expects to spend approximately $1.0 billion in cash capital expenditures.
Net cash flow used by financing activities was $768.1 million in 2010, $1,600.3 million in 2009 and $594.3 million in
2008. In 2010, Safeway paid down $84.8 million of debt, repurchased $621.1 million of common stock and paid $168.1
million in dividends. In 2009, Safeway paid down $599.5 million of debt, repurchased $884.9 million of common stock
and paid $153.1 million in dividends. In 2008, the Company paid down $130.0 million of debt, repurchased $359.5
million of common stock and paid $132.1 million in dividends.
Cash and cash equivalents was $778.8 million at year-end 2010 and $471.5 million at year-end 2009. A substantial
portion of this cash is at our Canadian subsidiary which has free cash flow in excess of debt servicing requirements.
Undistributed earnings of the Company’s foreign operations are considered to be permanently reinvested at January 1,
2011. There is a material tax cost to repatriating Canadian earnings.
Based upon the current level of operations, Safeway believes that net cash flow from operating activities and other
sources of liquidity, including potential borrowing under Safeway’s commercial paper program and its credit agreement,
will be adequate to meet anticipated requirements for working capital, capital expenditures, interest payments, dividend
payments, stock repurchases, if any, and scheduled principal payments for the foreseeable future. There can be no
assurance, however, that Safeway’s business will continue to generate cash flow at or above current levels or that the
Company will maintain its ability to borrow under its commercial paper program and credit agreement.
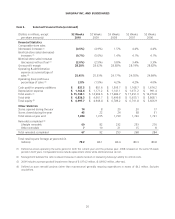
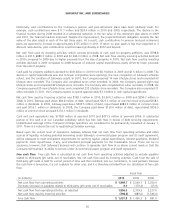
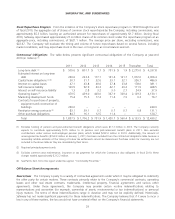
Free cash flow Free cash flow is calculated as net cash flow from operating activities adjusted to exclude payables
related to third-party gift cards, net of receivables, less net cash flow used by investing activities. Cash from the sale of
third-party gift cards is held for a short period of time and then remitted, less our commission, to card partners. Because
this cash flow is temporary, it is not available for other uses, and it is therefore excluded from our calculation of free cash
flow.
Fiscal Year
(in millions) 2010 2009 2008
Net cash flow from operating activities $ 1,849.7 $ 2,549.7 $ 2,250.9
Decrease (increase) in payables related to third-party gift cards, net of receivables 6.9 (170.4) (23.9)
Net cash flow from operating activities, as adjusted 1,856.6 2,379.3 2,227.0
Net cash flow used by investing activities (798.8) (889.0) (1,546.0)
Free cash flow $ 1,057.8 $ 1,490.3 $ 681.0
26