Safeway 2010 Annual Report Download - page 68
Download and view the complete annual report
Please find page 68 of the 2010 Safeway annual report below. You can navigate through the pages in the report by either clicking on the pages listed below, or by using the keyword search tool below to find specific information within the annual report.-
 1
1 -
2
-
3
-
4
-
5
-
6
-
7
-
8
-
9
-
10
-
11
-
12
-
13
-
14
-
15
-
16
-
17
-
18
-
19
-
20
-
21
-
22
-
23
-
24
-
25
-
26
-
27
-
28
-
29
-
30
-
31
-
32
-
33
-
34
-
35
-
36
-
37
-
38
-
39
-
40
-
41
-
42
-
43
-
44
-
45
-
46
-
47
-
48
-
49
-
50
-
51
-
52
-
53
-
54
-
55
-
56
-
57
-
 58
58 -
 59
59 -
 60
60 -
 61
61 -
 62
62 -
 63
63 -
 64
64 -
 65
65 -
 66
66 -
 67
67 -
 68
68 -
 69
69 -
 70
70 -
 71
71 -
 72
72 -
 73
73 -
 74
74 -
 75
75 -
 76
76 -
 77
77 -
 78
78 -
79
-
80
-
81
-
82
-
83
-
84
-
85
-
86
-
87
-
88
-
89
-
90
-
91
-
92
-
93
-
94
-
95
-
96
 |
 |

SAFEWAY INC. AND SUBSIDIARIES
Notes to Consolidated Financial Statements
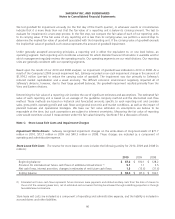
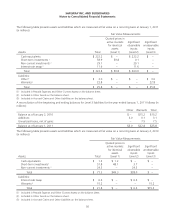
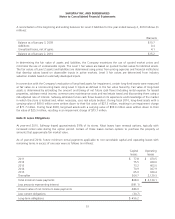
Future minimum lease payments under non-cancelable capital and operating lease agreements have not been reduced by
future minimum sublease rental income of $134.5 million.
Amortization expense for property under capital leases was $29.8 million in 2010, $34.6 million in 2009 and $38.8
million in 2008. Accumulated amortization of property under capital leases was $311.9 million at year-end 2010 and
$290.4 million at year-end 2009.
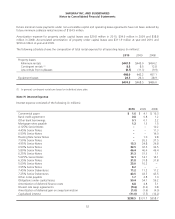
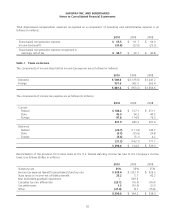
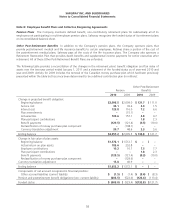
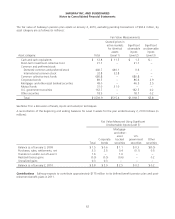
The following schedule shows the composition of total rental expense for all operating leases (in millions):
2010 2009 2008
Property leases:
Minimum rentals $447.9 $445.0 $454.2
Contingent rentals (1) 8.8 8.5 12.8
Less rentals from subleases (8.7) (11.3) (9.9)
448.0 442.2 457.1
Equipment leases 26.5 26.3 28.9
$474.5 $468.5 $486.0
(1) In general, contingent rentals are based on individual store sales.
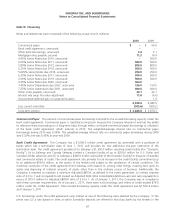
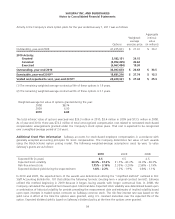
Note H: Interest Expense
Interest expense consisted of the following (in millions):
2010 2009 2008
Commercial paper $ 1.6 $ 4.1 $ 16.3
Bank credit agreement 0.8 0.8 1.2
Other bank borrowings 0.1 0.1 2.2
Mortgage notes payable 1.2 1.3 1.5
4.125% Senior Notes –– 10.2
4.45% Senior Notes –– 11.3
6.50% Senior Notes –– 14.0
Floating Rate Senior Notes –1.0 9.8
7.50% Senior Notes –26.3 37.5
4.95% Senior Notes 15.3 24.8 24.8
6.50% Senior Notes 32.5 32.5 32.5
5.80% Senior Notes 46.4 46.4 46.4
6.25% Senior Notes 31.3 31.3 1.1
5.625% Senior Notes 14.1 14.1 14.1
6.35% Senior Notes 31.8 31.8 31.8
5.00% Senior Notes 25.0 10.2 –
3.95% Senior Notes 8.2 ––
7.45% Senior Debentures 11.2 11.2 11.2
7.25% Senior Debentures 43.5 43.5 43.5
Other notes payable 1.7 2.8 1.3
Obligations under capital leases 50.4 54.1 59.2
Amortization of deferred finance costs 4.8 4.8 5.1
Interest rate swap agreements (9.4) (0.3) 0.8
Amortization of deferred gain on swap termination (1.0) (1.6) (4.9)
Capitalized interest (11.0) (7.5) (12.2)
$298.5 $331.7 $358.7
52