Safeway 2010 Annual Report Download - page 2
Download and view the complete annual report
Please find page 2 of the 2010 Safeway annual report below. You can navigate through the pages in the report by either clicking on the pages listed below, or by using the keyword search tool below to find specific information within the annual report.-
 1
1 -
 2
2 -
 3
3 -
 4
4 -
 5
5 -
 6
6 -
 7
7 -
 8
8 -
 9
9 -
 10
10 -
 11
11 -
 12
12 -
 13
13 -
14
-
15
-
16
-
17
-
18
-
19
-
20
-
21
-
22
-
23
-
24
-
25
-
26
-
27
-
28
-
29
-
30
-
31
-
32
-
33
-
34
-
35
-
36
-
37
-
38
-
39
-
40
-
41
-
42
-
43
-
44
-
45
-
46
-
47
-
48
-
49
-
50
-
51
-
52
-
53
-
54
-
55
-
56
-
57
-
58
-
59
-
60
-
61
-
62
-
63
-
64
-
65
-
66
-
67
-
68
-
69
-
70
-
71
-
72
-
73
-
74
-
75
-
76
-
77
-
78
-
79
-
80
-
81
-
82
-
83
-
84
-
85
-
86
-
87
-
88
-
89
-
90
-
91
-
92
-
93
-
94
-
95
-
96
 |
 |
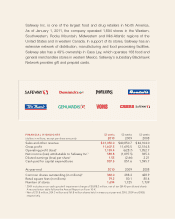
Safeway Inc. is one of the largest food and drug retailers in North America.
As of January 1, 2011, the company operated 1,694 stores in the Western,
Southwestern, Rocky Mountain, Midwestern and Mid-Atlantic regions of the
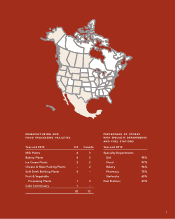
United States and in western Canada. In support of its stores, Safeway has an
extensive network of distribution, manufacturing and food processing facilities.
Safeway also has a 49% ownership in Casa Ley, which operates 168 food and
general merchandise stores in western Mexico. Safeway’s subsidiary Blackhawk
Network provides gift and prepaid cards.
FINANCIAL HIGHLIGHTS
(dollars in millions, except per-share amounts)
52 weeks
2010
52 weeks
2009
53 weeks
2008
Sales and other revenue $ 41,050.0 $ 40,850.7 $ 44,104.0
Gross profit 11,607.5 11,693.5 12,514.8
Operating profit (loss)11,159.4 (628.7)1,852.7
Net income (loss) attributable to Safeway Inc.1589.8 (1,097.5)965.3
Diluted earnings (loss) per share11.55 (2.66)2.21
Cash paid for capital expenditures 837.5 851.6 1,595.7
At year-end 2010 2009 2008
Common shares outstanding (in millions)2368.0 388.3 428.9
Retail square feet (in millions) 79.2 80.1 80.4
Number of stores 1,694 1,725 1,739
1 2009 includes a non-cash goodwill impairment charge of $1,818.2 million, net of tax ($4.40 per diluted share).
A reconciliation table follows the Annual Report on Form 10-K.
2 Net of 231.8 million, 204.3 million and 161.8 million shares held in treasury at year-end 2010, 2009 and 2008,
respectively.