Safeway 2010 Annual Report Download - page 80
Download and view the complete annual report
Please find page 80 of the 2010 Safeway annual report below. You can navigate through the pages in the report by either clicking on the pages listed below, or by using the keyword search tool below to find specific information within the annual report.-
 1
1 -
2
-
3
-
4
-
5
-
6
-
7
-
8
-
9
-
10
-
11
-
12
-
13
-
14
-
15
-
16
-
17
-
18
-
19
-
20
-
21
-
22
-
23
-
24
-
25
-
26
-
27
-
28
-
29
-
30
-
31
-
32
-
33
-
34
-
35
-
36
-
37
-
38
-
39
-
40
-
41
-
42
-
43
-
44
-
45
-
46
-
47
-
48
-
49
-
50
-
51
-
52
-
53
-
54
-
55
-
56
-
57
-
58
-
59
-
60
-
61
-
62
-
63
-
64
-
65
-
66
-
67
-
68
-
69
-
 70
70 -
 71
71 -
 72
72 -
 73
73 -
 74
74 -
 75
75 -
 76
76 -
 77
77 -
 78
78 -
 79
79 -
 80
80 -
 81
81 -
 82
82 -
 83
83 -
 84
84 -
 85
85 -
 86
86 -
 87
87 -
 88
88 -
 89
89 -
 90
90 -
91
-
92
-
93
-
94
-
95
-
96
 |
 |

SAFEWAY INC. AND SUBSIDIARIES
Notes to Consolidated Financial Statements
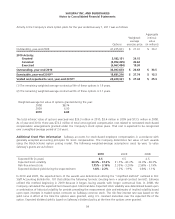
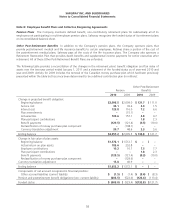
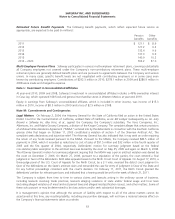
Commitments The Company has commitments under contracts for the purchase of property and equipment and for
the construction of buildings, marketing development funds, the purchase of energy and other purchase obligations.
Portions of such contracts not completed at year end are not reflected in the consolidated financial statements. These
purchase commitments were $581.5 million at year-end 2010.
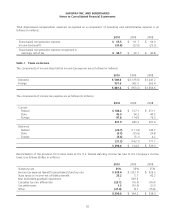
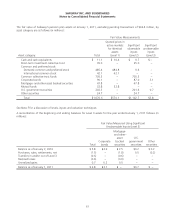
Note N: Segments
Safeway’s retail business, which represents more than 98% of consolidated sales and other revenue, operates in the U.S.
and Canada. Safeway is organized into 12 geographic retail operating segments (Chicago, Denver, Eastern, Northern
California, Phoenix, Portland, Seattle, Texas, Vons, Alberta, Vancouver and Winnipeg). Across all 12 retail operating
segments, the Company operates primarily one store format, where each store offers the same general mix of products
with similar pricing to similar categories of customers. Safeway does not operate supercenters, warehouse formats,
combination clothing/grocery stores or discount stores.
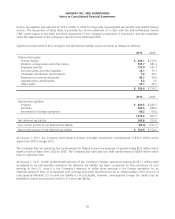
These 12 operating segments have been aggregated into one reportable segment because, in the Company’s judgment,
the operating segments have similar historical economic characteristics and are expected to have similar economic
characteristics and similar long-term financial performance in the future. The principal measures and factors we
considered in determining whether the economic characteristics are similar are gross margin percentage, operating profit
margin, sales growth, capital expenditures, competitive risks, operational risks and challenges, retail store sales, costs of
goods sold and employees. In addition, each operating segment has similar products, similar production processes, similar
types of customers, similar methods of distribution and a similar regulatory environment. The Company believes that
disaggregating its operating segments would not provide material additional information.
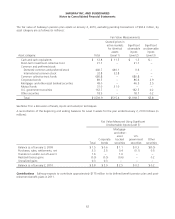
The difficult economic environment has had a negative impact on all of Safeway’s divisions. Two of these divisions, Vons
and Eastern, had large goodwill balances from purchase transactions which were impaired in 2009. Randall’s and
Dominick’s were also purchase transactions, but the goodwill related to those divisions was fully impaired in previous
years. Consequently, even though the economy has reduced operating results at all of the divisions, the material portion
of the 2009 goodwill impairment was at Vons and Eastern.
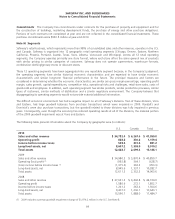
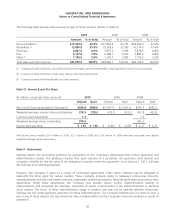
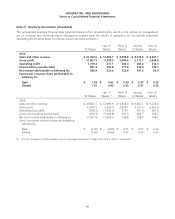
The following table presents information about the Company by geographic area (in millions):
U.S. Canada Total
2010
Sales and other revenue $ 34,782.4 $ 6,267.6 $ 41,050.0
Operating profit 828.8 330.6 1,159.4
Income before income taxes 549.6 331.6 881.2
Long-lived assets, net 8,607.2 1,303.0 9,910.2
Total assets 12,448.7 2,699.4 15,148.1
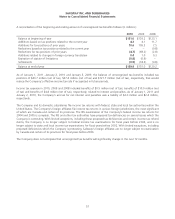
2009
Sales and other revenue $ 34,980.3 $ 5,870.4 $ 40,850.7
Operating (loss) profit (1) (992.8) 364.1 (628.7)
(Loss) income before income taxes (1) (1,315.6) 362.3 (953.3)
Long-lived assets, net 8,945.6 1,337.1 10,282.7
Total assets 12,611.3 2,352.3 14,963.6
2008
Sales and other revenue $ 37,661.2 $ 6,442.8 $ 44,104.0
Operating profit 1,580.6 272.1 1,852.7
Income before income taxes 1,241.2 263.4 1,504.6
Long-lived assets, net 9,407.0 1,236.1 10,643.1
Total assets 15,596.7 1,888.0 17,484.7
(1) 2009 includes a pre-tax goodwill impairment charge of $1,974.2 million in the U.S. See Note B.
64