Safeway 2010 Annual Report Download - page 76
Download and view the complete annual report
Please find page 76 of the 2010 Safeway annual report below. You can navigate through the pages in the report by either clicking on the pages listed below, or by using the keyword search tool below to find specific information within the annual report.-
 1
1 -
2
-
3
-
4
-
5
-
6
-
7
-
8
-
9
-
10
-
11
-
12
-
13
-
14
-
15
-
16
-
17
-
18
-
19
-
20
-
21
-
22
-
23
-
24
-
25
-
26
-
27
-
28
-
29
-
30
-
31
-
32
-
33
-
34
-
35
-
36
-
37
-
38
-
39
-
40
-
41
-
42
-
43
-
44
-
45
-
46
-
47
-
48
-
49
-
50
-
51
-
52
-
53
-
54
-
55
-
56
-
57
-
58
-
59
-
60
-
61
-
62
-
63
-
64
-
65
-
 66
66 -
 67
67 -
 68
68 -
 69
69 -
 70
70 -
 71
71 -
 72
72 -
 73
73 -
 74
74 -
 75
75 -
 76
76 -
 77
77 -
 78
78 -
 79
79 -
 80
80 -
 81
81 -
 82
82 -
 83
83 -
 84
84 -
 85
85 -
 86
86 -
87
-
88
-
89
-
90
-
91
-
92
-
93
-
94
-
95
-
96
 |
 |

SAFEWAY INC. AND SUBSIDIARIES
Notes to Consolidated Financial Statements
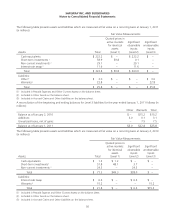
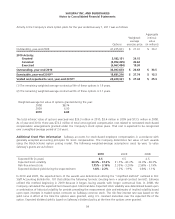
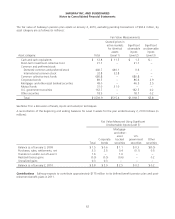
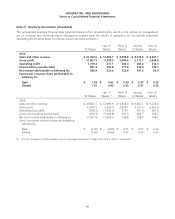
The actuarial assumptions used to determine year-end projected benefit obligations for pension plans were as follows:
2010 2009 2008
Discount rate:
United States plans 5.7% 6.2% 6.3%
Canadian plans 5.0 5.8 6.5
Combined weighted-average rate 5.6 6.1 6.3
Rate of compensation increase:
United States plans 3.0% 3.0% 3.0%
Canadian plans 2.5 3.0 3.0
The actuarial assumptions used to determine net periodic benefit costs for pension plans were as follows:
2010 2009 2008
Discount rate:
United States plans 6.2% 6.3% 6.1%
Canadian plans 5.8 6.5 5.3
Combined weighted-average rate 6.1 6.3 5.9
Expected return on plan assets:
United States plans 8.5% 8.5% 8.5%
Canadian plans 7.0 7.0 7.0
Rate of compensation increase:
United States plans 3.0% 3.0% 4.0%
Canadian plans 3.0 3.0 3.5
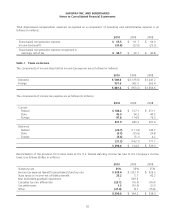
The Company has adopted and implemented an investment policy for the defined benefit pension plans that incorporates
a strategic long-term asset allocation mix designed to meet the Company’s long-term pension requirements. This asset
allocation policy is reviewed annually and, on a regular basis, actual allocations are rebalanced to the prevailing targets.
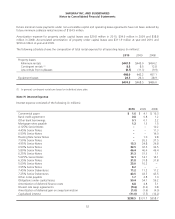
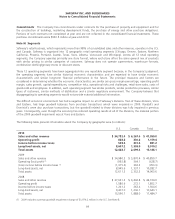
The following table summarizes actual allocations for Safeway’s plans at year-end:
Plan assets
Asset category Target 2010 2009
Equity 65% 67.6% 68.9%
Fixed income 35 31.1 30.3
Cash and other – 1.3 0.8
Total 100% 100.0% 100.0%
The investment policy also emphasizes the following key objectives: (1) maintain a diversified portfolio among asset
classes and investment styles; (2) maintain an acceptable level of risk in pursuit of long-term economic benefit;
(3) maximize the opportunity for value-added returns from active investment management while establishing investment
guidelines and monitoring procedures for each investment manager to ensure the characteristics of the portfolio are
consistent with the original investment mandate; and (4) maintain adequate controls over administrative costs.
Expected rates of return on plan assets were developed by determining projected stock and bond returns and then
applying these returns to the target asset allocations of the employee benefit trusts, resulting in a weighted-average rate
of return on plan assets. Equity returns were based primarily on historical returns of the S&P 500 Index. Fixed-income
projected returns were based primarily on historical returns for the broad U.S. bond market.
60