Safeway 2010 Annual Report Download - page 41
Download and view the complete annual report
Please find page 41 of the 2010 Safeway annual report below. You can navigate through the pages in the report by either clicking on the pages listed below, or by using the keyword search tool below to find specific information within the annual report.-
 1
1 -
2
-
3
-
4
-
5
-
6
-
7
-
8
-
9
-
10
-
11
-
12
-
13
-
14
-
15
-
16
-
17
-
18
-
19
-
20
-
21
-
22
-
23
-
24
-
25
-
26
-
27
-
28
-
29
-
30
-
 31
31 -
 32
32 -
 33
33 -
 34
34 -
 35
35 -
 36
36 -
 37
37 -
 38
38 -
 39
39 -
 40
40 -
 41
41 -
 42
42 -
 43
43 -
 44
44 -
 45
45 -
 46
46 -
 47
47 -
 48
48 -
 49
49 -
 50
50 -
 51
51 -
52
-
53
-
54
-
55
-
56
-
57
-
58
-
59
-
60
-
61
-
62
-
63
-
64
-
65
-
66
-
67
-
68
-
69
-
70
-
71
-
72
-
73
-
74
-
75
-
76
-
77
-
78
-
79
-
80
-
81
-
82
-
83
-
84
-
85
-
86
-
87
-
88
-
89
-
90
-
91
-
92
-
93
-
94
-
95
-
96
 |
 |
SAFEWAY INC. AND SUBSIDIARIES
evaluate for impairment is a two-step process. In the first step, we compare the fair value of each of our reporting units
to its carrying value. If the fair value of any reporting unit is less than its carrying value, we perform a second step to
determine the implied fair value of goodwill associated with that reporting unit. If the carrying value of goodwill exceeds
the implied fair value of goodwill, such excess represents the amount of goodwill impairment.
Under generally accepted accounting principles, a reporting unit is either the equivalent to, or one level below, an
operating segment. Each reporting unit constitutes a business for which discrete financial information is available and for
which segment management regularly reviews the operating results. Our operating segments are our retail divisions. Our
reporting units are generally consistent with our operating segments.
As a result of the Company’s annual impairment test, Safeway recorded a non-cash impairment charge in the amount of
$1,974.2 million (pre-tax) in 2009 to reduce the carrying value of goodwill. The impairment was due primarily to
Safeway’s reduced market capitalization and a weak economy. The difficult economic environment negatively impacted
all of Safeway’s divisions; however, due to their large goodwill balances, the goodwill impairment resulted primarily from
the Vons and Eastern divisions. Based upon the results of our analysis, no impairment of goodwill was indicated in 2010
or 2008.
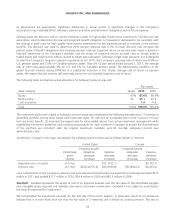
Determining the fair value of a reporting unit involves the use of significant estimates and assumptions. The estimated fair
value of each reporting unit is based on an average of the guideline company method and the discounted cash flow
method. These methods are based on historical and forecasted amounts specific to each reporting unit and consider,
sales, gross profit, operating profit and cash flows and general economic and market conditions, as well as the impact of
planned business and operational strategies. We base our fair value estimates on assumptions we believe to be
reasonable at the time, but such assumptions are subject to inherent uncertainty.
Actual results may be substantially different than the results forecasted in our estimate of a reporting unit’s fair value,
resulting in additional goodwill impairment in the future. Additionally, the aggregate fair value of all the reporting units is
reconciled to Safeway’s total market capitalization. Therefore, a significant and sustained decline in our stock price could
also result in additional impairment charges. However, the majority of the remaining $430.9 million of goodwill is at
reporting units that have estimated fair value that is at least 50% greater than book value. Reporting units, whose fair
value exceeds book value by less than 50%, have total goodwill of $106 million.
Income Tax Contingencies The Company is subject to periodic audits by the Internal Revenue Service and other
foreign, state and local taxing authorities. These audits may challenge certain of the Company’s tax positions such as the
timing and amount of income and deductions and the allocation of taxable income to various tax jurisdictions. The
Company evaluates its tax positions and establishes liabilities in accordance with the applicable accounting guidance on
uncertainty in income taxes. These tax uncertainties are reviewed as facts and circumstances change and are adjusted
accordingly. This requires significant management judgment in estimating final outcomes. Actual results could materially
differ from these estimates and could significantly affect the Company’s effective tax rate and cash flows in future
years. Note J to the consolidated financial statements set forth in Part II, Item 8 of this report provides additional
information on income taxes.
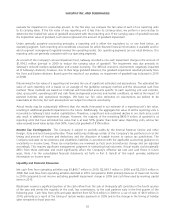
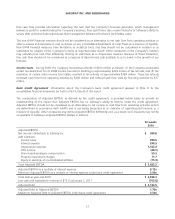
Liquidity and Financial Resources
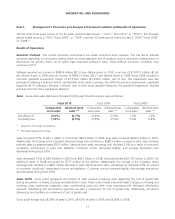
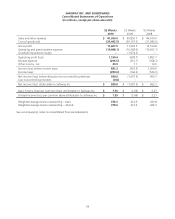
Net cash flow from operating activities was $1,849.7 million in 2010, $2,549.7 million in 2009 and $2,250.9 million in
2008. Net cash flow from operating activities declined in 2010 compared to 2009 primarily because of lower net income
in 2010 compared to net income excluding goodwill impairment charge in 2009 and cash flow used by working capital
items in 2010.
Blackhawk receives a significant portion of the cash inflow from the sale of third-party gift cards late in the fourth quarter
of the year and remits the majority of the cash, less commissions, to the card partners early in the first quarter of the
following year. Cash flow from gift-card sales declined from $170.4 million in 2009 to a use of cash of $6.9 million in
2010, primarily as a result of the timing of certain vendor payments in 2009 and to the change in the timing of holiday
sales compared to fiscal year end.
25