Safeway 2010 Annual Report Download - page 3
Download and view the complete annual report
Please find page 3 of the 2010 Safeway annual report below. You can navigate through the pages in the report by either clicking on the pages listed below, or by using the keyword search tool below to find specific information within the annual report.-
 1
1 -
 2
2 -
 3
3 -
 4
4 -
 5
5 -
 6
6 -
 7
7 -
 8
8 -
 9
9 -
 10
10 -
 11
11 -
 12
12 -
 13
13 -
 14
14 -
15
-
16
-
17
-
18
-
19
-
20
-
21
-
22
-
23
-
24
-
25
-
26
-
27
-
28
-
29
-
30
-
31
-
32
-
33
-
34
-
35
-
36
-
37
-
38
-
39
-
40
-
41
-
42
-
43
-
44
-
45
-
46
-
47
-
48
-
49
-
50
-
51
-
52
-
53
-
54
-
55
-
56
-
57
-
58
-
59
-
60
-
61
-
62
-
63
-
64
-
65
-
66
-
67
-
68
-
69
-
70
-
71
-
72
-
73
-
74
-
75
-
76
-
77
-
78
-
79
-
80
-
81
-
82
-
83
-
84
-
85
-
86
-
87
-
88
-
89
-
90
-
91
-
92
-
93
-
94
-
95
-
96
 |
 |

1
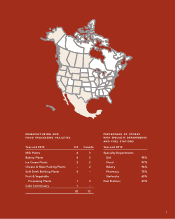
MANUFACTURING AND
FOOD PROCESSING FACILITIES
Year-end 2010 U.S. Canada
Milk Plants 6 3
Bakery Plants 6 2
Ice Cream Plants 2 2
Cheese & Meat Packing Plants – 2
Soft Drink Bottling Plants 4 –
Fruit & Vegetable
Processing Plants 1 3
Cake Commissary 1
–
20
12
PERCENTAGE OF STORES
WITH SPECIALTY DEPARTMENTS
AND FUEL S TATION S
Year-end 2010
Specialty Departments
Deli 98%
Floral 97%
Bakery 96%
Pharmacy 78%
Starbucks 69%
Fuel Stations 23%
1