Safeway 2010 Annual Report Download - page 56
Download and view the complete annual report
Please find page 56 of the 2010 Safeway annual report below. You can navigate through the pages in the report by either clicking on the pages listed below, or by using the keyword search tool below to find specific information within the annual report.-
 1
1 -
2
-
3
-
4
-
5
-
6
-
7
-
8
-
9
-
10
-
11
-
12
-
13
-
14
-
15
-
16
-
17
-
18
-
19
-
20
-
21
-
22
-
23
-
24
-
25
-
26
-
27
-
28
-
29
-
30
-
31
-
32
-
33
-
34
-
35
-
36
-
37
-
38
-
39
-
40
-
41
-
42
-
43
-
44
-
45
-
 46
46 -
 47
47 -
 48
48 -
 49
49 -
 50
50 -
 51
51 -
 52
52 -
 53
53 -
 54
54 -
 55
55 -
 56
56 -
 57
57 -
 58
58 -
 59
59 -
 60
60 -
 61
61 -
 62
62 -
 63
63 -
 64
64 -
 65
65 -
 66
66 -
67
-
68
-
69
-
70
-
71
-
72
-
73
-
74
-
75
-
76
-
77
-
78
-
79
-
80
-
81
-
82
-
83
-
84
-
85
-
86
-
87
-
88
-
89
-
90
-
91
-
92
-
93
-
94
-
95
-
96
 |
 |

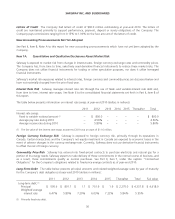
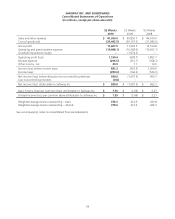
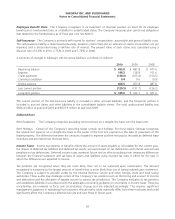
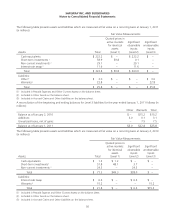
SAFEWAY INC. AND SUBSIDIARIES
Consolidated Statements of Stockholders’ Equity
(In millions, except per-share amounts)
52 Weeks
2010
52 Weeks
2009
53 Weeks
2008
Comprehensive Income (Loss)
Net income (loss) before allocation to noncontrolling interests $ 590.6 $(1,097.5) $ 965.3
Translation adjustments, net of tax 90.6 162.2 (226.7)
Pension and post-retirement benefits adjustment to funded status (38.9) (2.0) (266.1)
Recognition of pension and post-retirement benefits actuarial loss, net of tax 49.1 54.9 19.5
Other, net of tax 1.0 (0.2) (1.6)
Comprehensive income (loss) including noncontrolling interests $ 692.4 $ (882.6) $ 490.4
Comprehensive income attributable to noncontrolling interests (0.8) ––
Comprehensive income (loss) attributable to Safeway Inc. $ 691.6 $ (882.6) $ 490.4
Number of Shares Issued
Common Stock
Balance, beginning of year 592.6 590.7 589.3
Options exercised 6.1 1.5 1.4
Restricted stock grants 1.1 0.4 –
Balance, end of year 599.8 592.6 590.7
Number of Shares
Treasury Stock
Balance, beginning of year (204.3) (161.8) (149.2)
Purchase of treasury stock (27.4) (42.5) (12.6)
Other (0.1) ––
Balance, end of year (231.8) (204.3) (161.8)
See accompanying notes to consolidated financial statements.
40