Navy Federal Credit Union 2015 Annual Report Download - page 73
Download and view the complete annual report
Please find page 73 of the 2015 Navy Federal Credit Union annual report below. You can navigate through the pages in the report by either clicking on the pages listed below, or by using the keyword search tool below to find specific information within the annual report.-
 1
1 -
2
-
3
-
4
-
5
-
6
-
7
-
8
-
9
-
10
-
11
-
12
-
13
-
14
-
15
-
16
-
17
-
18
-
19
-
20
-
21
-
22
-
23
-
24
-
25
-
26
-
27
-
28
-
29
-
30
-
31
-
32
-
33
-
34
-
35
-
36
-
37
-
38
-
39
-
40
-
41
-
42
-
43
-
44
-
45
-
46
-
47
-
48
-
49
-
50
-
51
-
52
-
53
-
54
-
55
-
56
-
57
-
58
-
59
-
60
-
61
-
62
-
 63
63 -
 64
64 -
 65
65 -
 66
66 -
 67
67 -
 68
68 -
 69
69 -
 70
70 -
 71
71 -
 72
72 -
 73
73 -
 74
74 -
 75
75 -
 76
76 -
 77
77 -
 78
78
 |
 |
Navy Federal Credit Union54
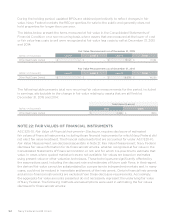
Navy Federal has elected to use the income approach to value its interest rate swaps, using
observable Level 2 market expectations at the measurement date. A standard valuation technique
is used to convert future cash flow amounts to a single present amount (discounted), assuming
participants are motivated but not compelled to transact. The future cash flows are discounted to
present value using the OIS rate at measurement date. The OIS curve, which is considered a risk-
free curve, is used for discounting because the swaps are fully collateralized with liquid collateral.
Mortgage Servicing Rights (MSRs)
MSRs do not trade in an active, open market with readily observable prices. Navy Federal obtains
the fair value of its MSRs from a third-party service organization, which determines fair value by
discounting projected net servicing cash flows of Navy Federal’s servicing portfolio, taking into
consideration actual and expected loan prepayment rate, discount rate, servicing costs and other
economic factors.
Securities Sold Under Repurchase Agreements and Other Borrowings,
Including FHLB Borrowed Funds
The fair values of FHLB borrowings and securities sold under repurchase agreements are based
on discounted expected cash flows using FHLB and market rates, respectively.
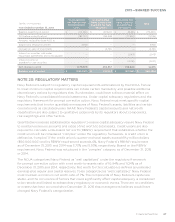
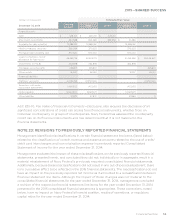
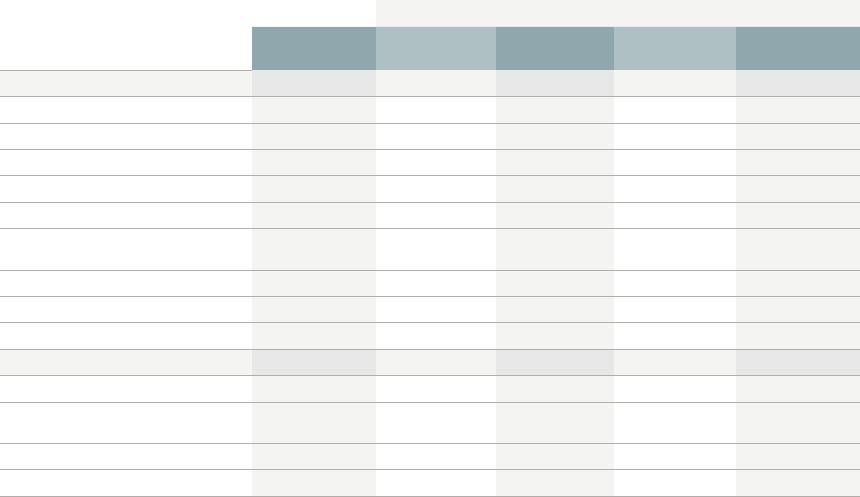
The estimated fair values of financial instruments at December 31 were:
(dollars in thousands) Estimated Fair Value
December 31, 2015 Carrying
Amount Total Level 1 Level 2 Level 3
Financial assets:
Cash $ 500,312 $ 500,312 $ 500,312
Short-term investments 2,115,248 2,115,248 2,084,848 $ 30,400
Available-for-sale securities 13,859,916 13,859,916 13,859,916
Held-to-maturity securities 314,627 315,656 315,656
Mortgage loans awaiting sale 708,015 708,015 708,015
Loans to members, net of
allowance for loan losses 52,325,503 59,391,427 25,575,793 $ 33,815,634
Investments in FHLBs 642,846 642,846 642,846
Mortgage servicing rights 270,876 270,876 270,876
Other assets 22,444 22,444 1,741 20,703
Financial liabilities:
Members’ accounts 48,865,873 45,470,678 45,470,678
Securities sold under
repurchase agreements 719,982 723,397 723,397
Notes payable 14,772,855 15,032,199 15,032,199
Other liabilities 41,625 41,625 41,606 19