Navy Federal Credit Union 2015 Annual Report Download - page 61
Download and view the complete annual report
Please find page 61 of the 2015 Navy Federal Credit Union annual report below. You can navigate through the pages in the report by either clicking on the pages listed below, or by using the keyword search tool below to find specific information within the annual report.-
 1
1 -
2
-
3
-
4
-
5
-
6
-
7
-
8
-
9
-
10
-
11
-
12
-
13
-
14
-
15
-
16
-
17
-
18
-
19
-
20
-
21
-
22
-
23
-
24
-
25
-
26
-
27
-
28
-
29
-
30
-
31
-
32
-
33
-
34
-
35
-
36
-
37
-
38
-
39
-
40
-
41
-
42
-
43
-
44
-
45
-
46
-
47
-
48
-
49
-
50
-
 51
51 -
 52
52 -
 53
53 -
 54
54 -
 55
55 -
 56
56 -
 57
57 -
 58
58 -
 59
59 -
 60
60 -
 61
61 -
 62
62 -
 63
63 -
 64
64 -
 65
65 -
 66
66 -
 67
67 -
 68
68 -
 69
69 -
 70
70 -
 71
71 -
72
-
73
-
74
-
75
-
76
-
77
-
78
 |
 |
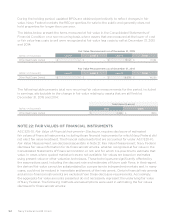
Navy Federal Credit Union42
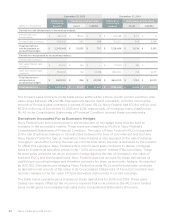
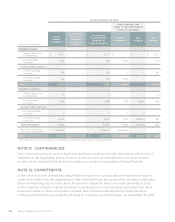
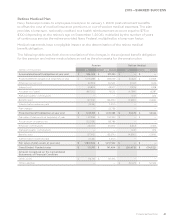
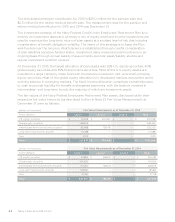
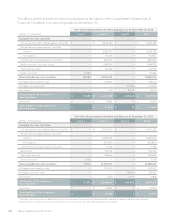
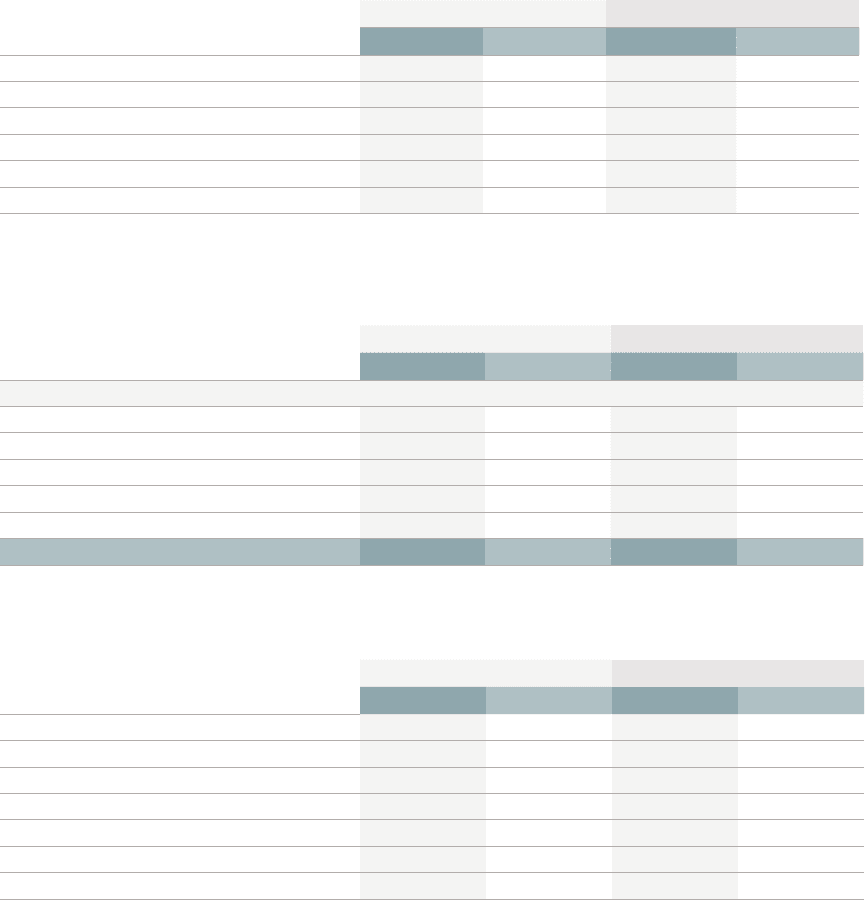
The weighted-average assumptions used to determine the projected benefit obligation for the
pension and retiree medical benefit plans were as follows:
Pension Retiree Medical
2015 2014 2015 2014
Discount rate 4.60% 4.15% 4.60% 4.15%
Rate of compensation increase 4.41% 4.25% N/A N /A
Assumed health care cost trend rate
Initial trend N /A N/A 7.00% 7.00%
Ultimate trend N /A N/A 5.00% 5.00%
Year ultimate trend reached N/A N /A 2022 2022
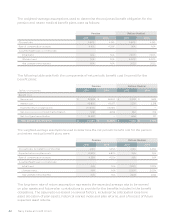
The following table sets forth the components of net periodic benefit cost (income) for the
benefit plans:
Pension Retiree Medical
(dollars in thousands) 2015 2014 2015 2014
Benefit Cost:
Service cost $ 32,593 $ 26,540 $ 2,002 $ 1,623
Interest cost 45,802 43,977 2,276 2,318
Expected return on plan assets (77,530) (76,137) — —
Net prior service cost/(credit) amortization 5,161 3,053 554 746
Net loss/(gain) amortization 14,540 — 606 107
Total benefit cost/(income) $ 20,566 $ (2,567) $ 5,438 $ 4,794
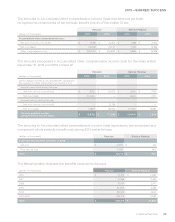
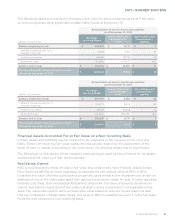
The weighted-average assumptions used to determine the net periodic benefit cost for the pension
and retiree medical benefit plans were:
Pension Retiree Medical
2015 2014 2015 2014
Discount rate: for benefit cost/(income) 4.15% 5.05% 4.15% 5.05%
Expected return on plan assets 6.50% 6.80% N/A N /A
Rate of compensation increase 4.25% 4.25% N/A N /A
Assumed health care cost trend rate
Initial trend N /A N/A 7.00% 7.00%
Ultimate trend N/A N /A 5.00% 5.00%
Year ultimate trend reached N /A N/A 2022 2022
The long-term rate of return assumption represents the expected average rate to be earned
on plan assets and future plan contributions to provide for the benefits included in the benefit
obligations. The assumption is based on several factors, including the anticipated long-term
asset allocation of plan assets, historical market index and plan returns, and a forecast of future
expected asset returns.