Navy Federal Credit Union 2015 Annual Report Download - page 37
Download and view the complete annual report
Please find page 37 of the 2015 Navy Federal Credit Union annual report below. You can navigate through the pages in the report by either clicking on the pages listed below, or by using the keyword search tool below to find specific information within the annual report.-
 1
1 -
2
-
3
-
4
-
5
-
6
-
7
-
8
-
9
-
10
-
11
-
12
-
13
-
14
-
15
-
16
-
17
-
18
-
19
-
20
-
21
-
22
-
23
-
24
-
25
-
26
-
 27
27 -
 28
28 -
 29
29 -
 30
30 -
 31
31 -
 32
32 -
 33
33 -
 34
34 -
 35
35 -
 36
36 -
 37
37 -
 38
38 -
 39
39 -
 40
40 -
 41
41 -
 42
42 -
 43
43 -
 44
44 -
 45
45 -
 46
46 -
 47
47 -
48
-
49
-
50
-
51
-
52
-
53
-
54
-
55
-
56
-
57
-
58
-
59
-
60
-
61
-
62
-
63
-
64
-
65
-
66
-
67
-
68
-
69
-
70
-
71
-
72
-
73
-
74
-
75
-
76
-
77
-
78
 |
 |
Navy Federal Credit Union18
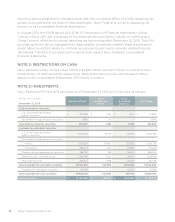
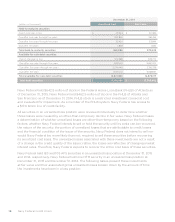
During the years ended December 31, 2015 and 2014, there were no declines in the fair value of
securities held by Navy Federal that were considered other-than-temporary.
As of December 31, 2015 and 2014, Navy Federal had $0.7 billion and $1.5 billion, respectively, in
investments pledged as collateral for borrowed funds under repurchase agreements. See Note 16:
Borrowed Funds for associated liability.
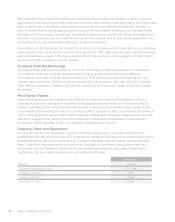
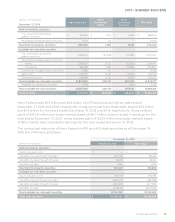
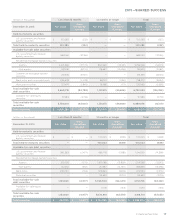
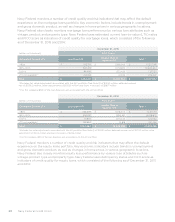
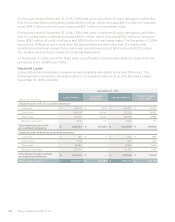
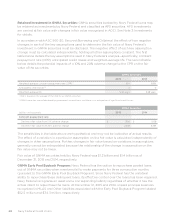
NOTE 4: LOANS AND ALLOWANCE FOR LOAN AND LEASE LOSSES
The Navy Federal loan portfolio consists of consumer, credit card and real estate loans. Consumer
loans consist of auto loans, signature loans, checking lines of credit and education loans. Real
estate loans consist of mortgage and equity loans. The composition of loans by portfolio and
delinquency status of Navy Federal’s loans to members as of December 31, 2015 and 2014 was
as follows:
December 31, 2015
(dollars in
thousands)
Current
1 to < 2
Months
Delinquent
2 to < 6
Months
Delinquent
>= 6
Months
Delinquent
Total
Delinquent
Loans
Amortized
Cost/(Deferred
Income)
Total Loans
Consumer loans $ 15,359,538 $ 159,793 $ 203,789 $ 3,355 $ 366,937 $ 21,920 $ 15,748,395
Credit card loans 10,509,044 93,433 157,931 38 251,402 486 10,760,932
Mortgage loans 24,270,556 125,985 61,183 49,069 236,237 (139,545) 24,367,248
Equity loans 2,349,495 29,210 14,928 13,099 57,237 8,175 2,414,907
Total loans to
members $ 52,488,633 $ 408,421 $ 437,831 $ 65,561 $ 911,813 $ (108,964) $ 53,291,482
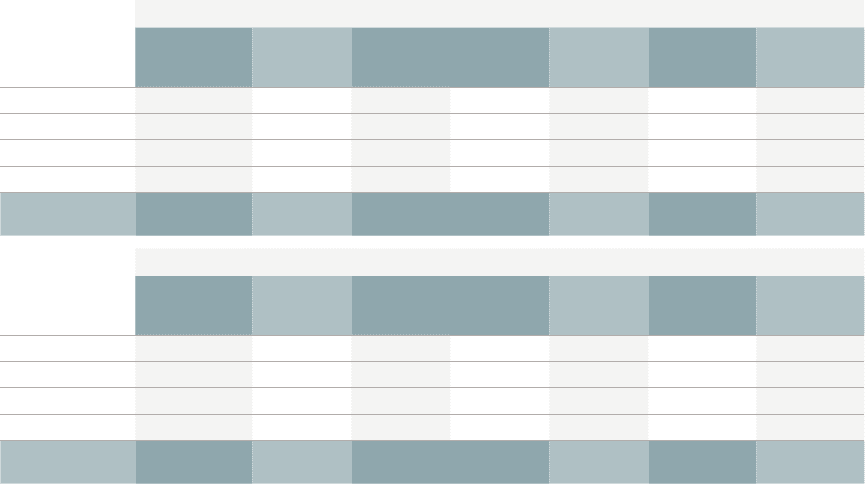
December 31, 2014
(dollars in
thousands)
Current
1 to < 2
Months
Delinquent
2 to < 6
Months
Delinquent
>= 6
Months
Delinquent
Total
Delinquent
Loans
Amortized
Cost/(Deferred
Income)
Total Loans
Consumer loans $ 13,798,031 $ 145,318 $ 152,027 $ 3,674 $ 301,019 $ 13,009 $ 14,112,059
Credit card loans 9,300,873 86,721 119,658 40 206,419 534 9,507,826
Mortgage loans 20,098,835 100,761 47,554 45,060 193,375 (116,955) 20,175,255
Equity loans 2,330,508 34,159 20,820 21,544 76,523 12,399 2,419,430
Total loans to
members $ 45,528,247 $ 366,959 $ 340,059 $ 70,318 $ 777,336 $ (91,013) $ 46,214,570
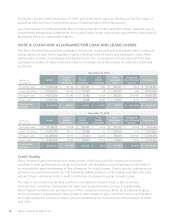
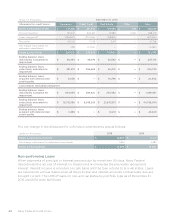
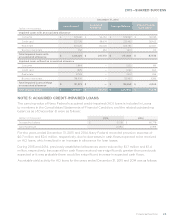
Credit Quality
Navy Federal closely monitors the credit quality of its loan portfolio based on economic
conditions, loan performance trends, and certain risk attributes, and utilizes such information
to evaluate the appropriateness of the allowance for credit losses. Credit quality indicators are
obtained and updated quarterly. The following tables present credit quality indicators by loan
product type: consumer loans, credit card loans, mortgage loans and equity loans.
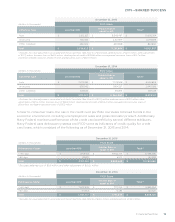
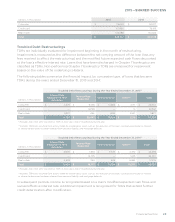
The risk in our consumer lending portfolio correlates to broad trends in the economic
environment, including unemployment rates and gross domestic product. Additionally,
Navy Federal monitors the performance of the consumer loans portfolio by attributes relating
to the borrower’s engagement. Navy Federal uses collateral type and FICO score as indicators
of credit quality for consumer loans, which consisted of the following as of December 31, 2015
and 2014: