Navy Federal Credit Union 2015 Annual Report Download - page 36
Download and view the complete annual report
Please find page 36 of the 2015 Navy Federal Credit Union annual report below. You can navigate through the pages in the report by either clicking on the pages listed below, or by using the keyword search tool below to find specific information within the annual report.-
 1
1 -
2
-
3
-
4
-
5
-
6
-
7
-
8
-
9
-
10
-
11
-
12
-
13
-
14
-
15
-
16
-
17
-
18
-
19
-
20
-
21
-
22
-
23
-
24
-
25
-
 26
26 -
 27
27 -
 28
28 -
 29
29 -
 30
30 -
 31
31 -
 32
32 -
 33
33 -
 34
34 -
 35
35 -
 36
36 -
 37
37 -
 38
38 -
 39
39 -
 40
40 -
 41
41 -
 42
42 -
 43
43 -
 44
44 -
 45
45 -
 46
46 -
47
-
48
-
49
-
50
-
51
-
52
-
53
-
54
-
55
-
56
-
57
-
58
-
59
-
60
-
61
-
62
-
63
-
64
-
65
-
66
-
67
-
68
-
69
-
70
-
71
-
72
-
73
-
74
-
75
-
76
-
77
-
78
 |
 |
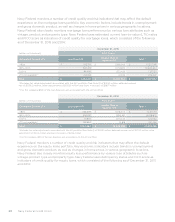
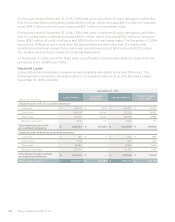
Financial Section 17
2015—SHARED SUCCESS
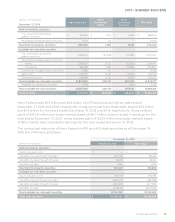
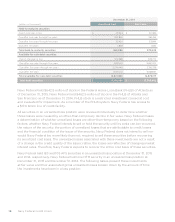
(dollars in thousands) Less than 12 months 12 months or longer Total
December 31, 2015 Fair Value
Gross
Unrealized
(Losses)
Fair Value
Gross
Unrealized
(Losses)
Fair Value
Gross
Unrealized
(Losses)
Held-to-maturity securities
U.S. government and federal
agency securities $ 100,285 $ (232) $ — $ — $ 100,285 $ (232)
Total held-to-maturity securities 100,285 (232) — — 100,285 (232)
Available-for-sale debt securities
U.S. government and federal
agency securities 1,682,199 (37,316) — — 1,682,199 (37,316)
Residential mortgage-backed securities
Agency 2,421,966 (27,772) 834,960 (25,331) 3,256,926 (53,103)
Non-agency 537,916 (8,774) 178,687 (12,408) 716,603 (21,182)
Commercial mortgage-backed
securities 251,535 (3,604) — — 251,535 (3,604)
Bank notes and corporate bonds 659,628 (4,478) 98,742 (1,156) 758,370 (5,634)
Municipal securities 107,474 (2,845) 19,486 (711) 126,960 (3,556)
Total available-for-sale
debt securities 5,660,718 (84,789) 1,131,875 (39,606) 6,792,593 (124,395)
Available-for-sale equity
securities 97,283 (2,716) — — 97,283 (2,716)
Total available-for-sale
securities 5,758,001 (87,505) 1,131,875 (39,606) 6,889,876 (127,111)
Total securities $ 5,858,286 $ (87,737) $ $1,131,875 $ (39,606) $ 6,990,161 $ (127,343)
(dollars in thousands) Less than 12 months 12 months or longer Total
December 31, 2014 Fair Value
Gross
Unrealized
(Losses)
Fair Value
Gross
Unrealized
(Losses)
Fair Value
Gross
Unrealized
(Losses)
Held-to-maturity securities
U.S. government and federal
agency securities $ — $ — $ 100,023 $ (648) $ 100,023 $ (648)
Total held-to-maturity securities — — 100,023 (648) 100,023 (648)
Available-for-sale debt securities
U.S. government and federal
agency securities 380,383 (2,477) 665,776 (11,881) 1,046,159 (14,358)
Residential mortgage-backed securities
Agency 372,095 (1,075) 1,671,086 (31,838) 2,043,181 (32,913)
Non-agency 142,252 (662) 217,587 (12,734) 359,839 (13,396)
Bank notes 239,090 (763) 375,864 (3,813) 614,954 (4,576)
Municipal securities — — 93,633 (2,179) 93,633 (2,179)
Total available-for-sale
debt securities 1,133,820 (4,977) 3,023,946 (62,445) 4,157,766 (67,422)
Available-for-sale equity
securities — — 11,015 (133) 11,015 (133)
Total available-for-sale
securities 1,133,820 (4,977) 3,034,961 (62,578) 4,168,781 (67,555)
Total securities $ 1,133,820 $ (4,977) $ 3,134,984 $ (63,226) $ 4,268,804 $ (68,203)