Navy Federal Credit Union 2015 Annual Report Download - page 38
Download and view the complete annual report
Please find page 38 of the 2015 Navy Federal Credit Union annual report below. You can navigate through the pages in the report by either clicking on the pages listed below, or by using the keyword search tool below to find specific information within the annual report.-
 1
1 -
2
-
3
-
4
-
5
-
6
-
7
-
8
-
9
-
10
-
11
-
12
-
13
-
14
-
15
-
16
-
17
-
18
-
19
-
20
-
21
-
22
-
23
-
24
-
25
-
26
-
27
-
 28
28 -
 29
29 -
 30
30 -
 31
31 -
 32
32 -
 33
33 -
 34
34 -
 35
35 -
 36
36 -
 37
37 -
 38
38 -
 39
39 -
 40
40 -
 41
41 -
 42
42 -
 43
43 -
 44
44 -
 45
45 -
 46
46 -
 47
47 -
 48
48 -
49
-
50
-
51
-
52
-
53
-
54
-
55
-
56
-
57
-
58
-
59
-
60
-
61
-
62
-
63
-
64
-
65
-
66
-
67
-
68
-
69
-
70
-
71
-
72
-
73
-
74
-
75
-
76
-
77
-
78
 |
 |

Financial Section 19
2015—SHARED SUCCESS
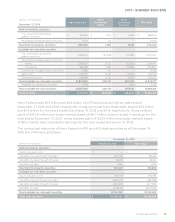
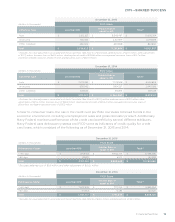
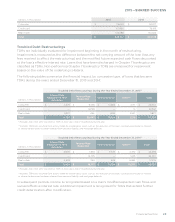
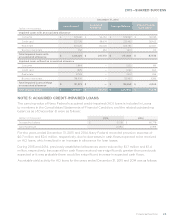
December 31, 2015
(dollars in thousands) FICO Score
Collateral Type Less than 610 Greater than or
equal to 610 Total(1)
Auto $ 2,612,327 $ 8,343,467 $ 10,955,794
Unsecured 790,354 2,307,519 3,097,873
Other Collateral 236,942 630,898 867,840
Total $ 3,639,623 $ 11,281,884 $ 14,921,507
(1)Excludes fair value adjustments associated with the ACI portfolio (See Note 5) of $1.6 million, deferred costs of $21.9 million, other adjustments
of $(7.7) million, business loans of $44.5 million, checking line of credit of $399.8 million, pre-approved consumer loans of $12.7 million,
overdrawn member accounts of $32.7 million and education loans of $321.6 million.
December 31, 2014
(dollars in thousands) FICO Score
Collateral Type Less than 610 Greater than or
equal to 610 Total(1)
Auto $ 2,209,261 $ 7,723,548 $ 9,932,809
Unsecured 676,042 1,964,527 2,640,569
Other Collateral 228,624 576,515 805,139
Total $ 3,113,927 $ 10,264,590 $ 13,378,517
(1)Excludes fair value adjustments associated with the ACI portfolio (See Note 5) of $(1.0) million, deferred costs of $13.0 million, other
adjustments of $(1.6) million, business loans of $38.9 million, checking line of credit of $356.4 million, pre-approved consumer loans of
$11.8 million and federal education loans of $315.3 million.
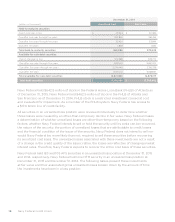
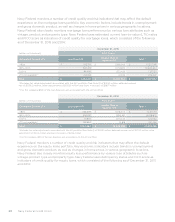
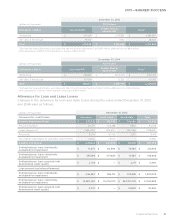
Similar to consumer loans, the risk in the credit card portfolio correlates to broad trends in the
economic environment, including unemployment rates and gross domestic product. Additionally,
Navy Federal monitors performance of the credit card portfolio by several dierent attributes.
Navy Federal uses delinquency status and FICO score as indicators of credit quality for credit
card loans, which consisted of the following as of December 31, 2015 and 2014:
December 31, 2015
(dollars in thousands) FICO Score
Delinquency Status Less than 610 Greater than or
equal to 610 Total(1)
<=60 days $ 1,945,912 $ 8,652,473 $ 10,598,385
>60 days 155,311 6,972 162,283
Total $ 2,101,223 $ 8,659,445 $ 10,760,668
(1)Excludes deferred cost of $0.5 million and other adjustment of $(0.2) million.
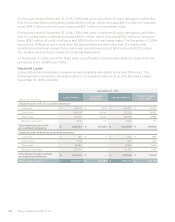
December 31, 2014
(dollars in thousands) FICO Score
Delinquency Status Less than 610 Greater than or
equal to 610 Total(1)
<=60 days $ 1,675,335 $ 7,710,159 $ 9,385,494
>60 days 117,442 6,485 123,927
Total $ 1,792,777 $ 7,716,644 $ 9,509,421
(1)Excludes fair value adjustments associated with the ACI portfolio (See Note 5) of $(2.1) million and deferred cost of $0.5 million.