Navy Federal Credit Union 2015 Annual Report Download - page 49
Download and view the complete annual report
Please find page 49 of the 2015 Navy Federal Credit Union annual report below. You can navigate through the pages in the report by either clicking on the pages listed below, or by using the keyword search tool below to find specific information within the annual report.-
 1
1 -
2
-
3
-
4
-
5
-
6
-
7
-
8
-
9
-
10
-
11
-
12
-
13
-
14
-
15
-
16
-
17
-
18
-
19
-
20
-
21
-
22
-
23
-
24
-
25
-
26
-
27
-
28
-
29
-
30
-
31
-
32
-
33
-
34
-
35
-
36
-
37
-
38
-
 39
39 -
 40
40 -
 41
41 -
 42
42 -
 43
43 -
 44
44 -
 45
45 -
 46
46 -
 47
47 -
 48
48 -
 49
49 -
 50
50 -
 51
51 -
 52
52 -
 53
53 -
 54
54 -
 55
55 -
 56
56 -
 57
57 -
 58
58 -
 59
59 -
60
-
61
-
62
-
63
-
64
-
65
-
66
-
67
-
68
-
69
-
70
-
71
-
72
-
73
-
74
-
75
-
76
-
77
-
78
 |
 |
Navy Federal Credit Union30
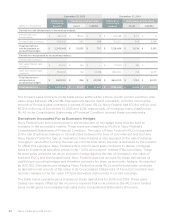
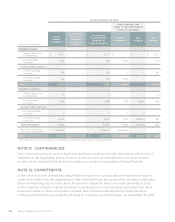
The liability recognized for estimated losses related to these loss-sharing agreements is included
in Other liabilities in the Consolidated Statements of Financial Condition. In the Consolidated
Statements of Income, the related expense is included as an oset to Net gains on mortgage
loan sales for loans sold during the current period, or in Loan servicing expenses for any re-
measurement of the liability related to loans sold in prior years.
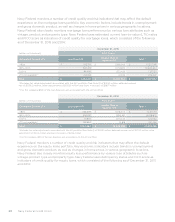
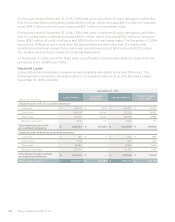
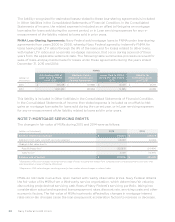
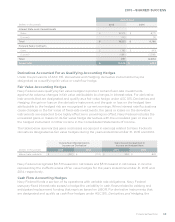
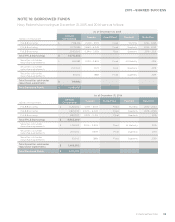
FNMA Loss-Sharing Agreements: Navy Federal sold mortgage loans to FNMA under loss-sharing
agreements from years 2006 to 2008, whereby Navy Federal agreed to indemnify FNMA for
loans having high LTV ratios through the life of the loans and for losses related to other loans,
with higher LTV ratios and no private mortgage insurance, that occur during a period of three
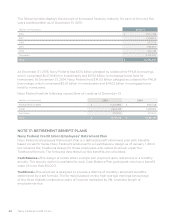
years from the applicable setlement date. The following table summarizes proceeds received for
sales of loans and payments made for losses under these agreements during the years ended
December 31, 2015 and 2014:
FNMA
(dollars in
thousands)
Outstanding UPB of
Loans Sold to FNMA
as of 12/31
Maximum Future
Exposure Under Loss-
Sharing Agreements
Losses Paid to FNMA
during the year ended
12/31
Liability for
Estimated Losses
as of 12/31
2015 $ 525,138 $ 107,586 $ 14,029 $ 27,277
2014 1,330,333 239,852 14,385 26,852
This liability is included in Other liabilities in the Consolidated Statements of Financial Condition.
In the Consolidated Statements of Income, the related expense is included as an oset to Net
gains on mortgage loan sales for loans sold during the current year, or in Loan servicing expenses
for any re-measurement of the liability related to loans sold in prior years.
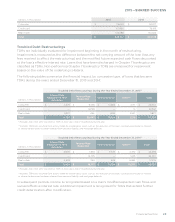
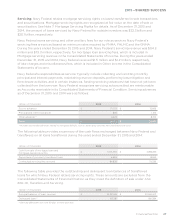
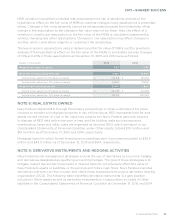
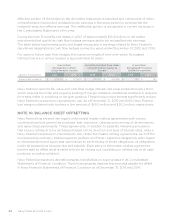
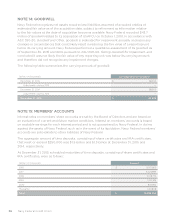
NOTE 7: MORTGAGE SERVICING RIGHTS
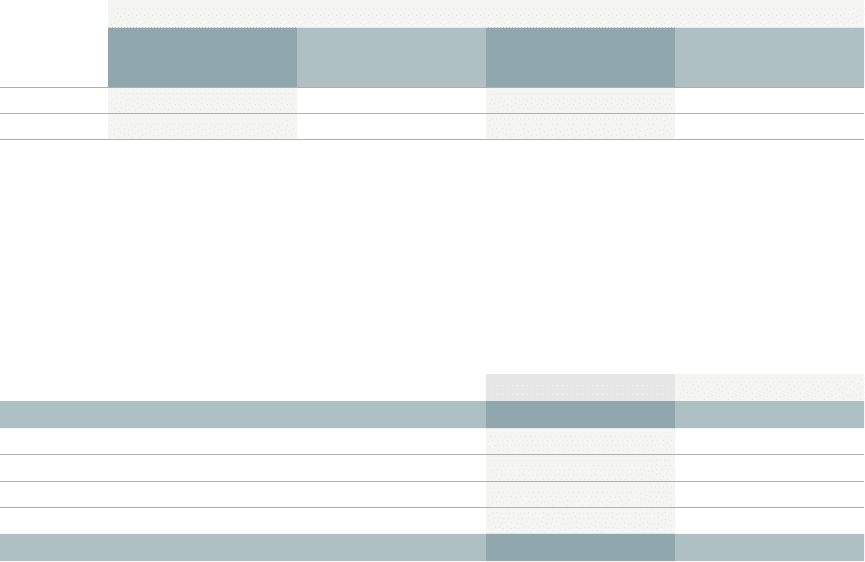
The changes in fair value of MSRs during 2015 and 2014 were as follows:
(dollars in thousands) 2015 2014
Balance, beginning of period $ 235,801 $ 236,579
Additions from loans sold with servicing retained 63,099 34,063
Change in fair value due to:
Payos/maturities(1) (32,083) (24,464)
Gain/(loss)(2) 4,059 (10,377)
Balance, end of period $ 270,876 $ 235,801
(1)Represents MSR value changes resulting from passage of time, including the impact from scheduled loan principal payments and loans that
were paid down or paid o during the period.
(2)Represents MSR value changes resulting primarily from market-driven changes in interest rates.
MSRs do not trade in an active, open market with readily observable prices. Navy Federal obtains
the fair value of its MSRs from a third-party service organization, which determines fair value by
discounting projected net servicing cash flows of Navy Federal’s servicing portfolio, taking into
consideration actual and expected loan prepayment rates, discount rate, servicing costs and other
economic factors. The fair value of MSRs is primarily aected by changes in mortgage interest
rates since rate changes cause the loan prepayment acceleration factors to increase or decrease.