Navy Federal Credit Union 2015 Annual Report Download - page 39
Download and view the complete annual report
Please find page 39 of the 2015 Navy Federal Credit Union annual report below. You can navigate through the pages in the report by either clicking on the pages listed below, or by using the keyword search tool below to find specific information within the annual report.-
 1
1 -
2
-
3
-
4
-
5
-
6
-
7
-
8
-
9
-
10
-
11
-
12
-
13
-
14
-
15
-
16
-
17
-
18
-
19
-
20
-
21
-
22
-
23
-
24
-
25
-
26
-
27
-
28
-
 29
29 -
 30
30 -
 31
31 -
 32
32 -
 33
33 -
 34
34 -
 35
35 -
 36
36 -
 37
37 -
 38
38 -
 39
39 -
 40
40 -
 41
41 -
 42
42 -
 43
43 -
 44
44 -
 45
45 -
 46
46 -
 47
47 -
 48
48 -
 49
49 -
50
-
51
-
52
-
53
-
54
-
55
-
56
-
57
-
58
-
59
-
60
-
61
-
62
-
63
-
64
-
65
-
66
-
67
-
68
-
69
-
70
-
71
-
72
-
73
-
74
-
75
-
76
-
77
-
78
 |
 |
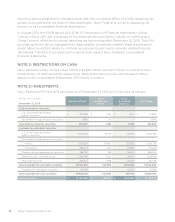
Navy Federal Credit Union20
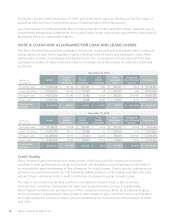
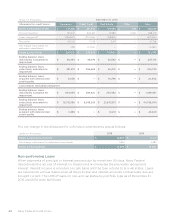
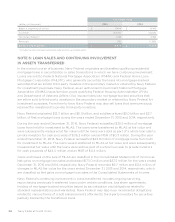
Navy Federal monitors a number of credit quality and risk indicators that may aect the default
experience on the mortgage loans portfolio. Key economic factors include trends in unemployment
and gross domestic product, as well as changes in home prices in various geographic locations.
Navy Federal also closely monitors mortgage loan performance by various loan attributes such as
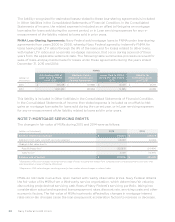
vintage, product and property type. Navy Federal uses estimated current loan-to-value (LTV) ratios
and FICO score as indicators of credit quality for mortgage loans, which consisted of the following
as of December 31, 2015 and 2014:
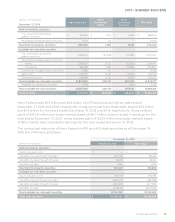
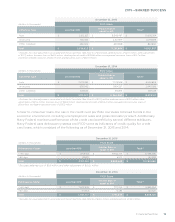
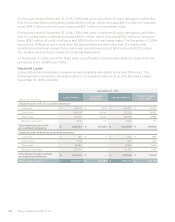
December 31, 2015
(dollars in thousands) FICO Score
Estimated Current LTV Less than 610 Greater than or
equal to 610 Total(1)
<80% $ 525,132 $ 11,681,949 $ 12,207,081
80%–100% 547,472 10,114,872 10,662,344
100+% 84,699 1,272,426 1,357,125
LTV not available(2) 214,914 61,493 276,407
Total $ 1,372,217 $ 23,130,740 $ 24,502,957
(1)Excludes fair value adjustments associated with the ACI portfolio (See Note 5) of $(9.9) million, deferred income,
net of $(139.5) million, other adjustments of $(15.0) million and loans in process of $28.7 million.
(2)For this category, 89% of the loan balances are associated with the ACI portfolio.
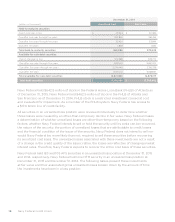
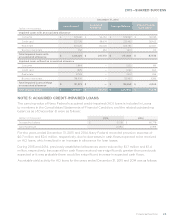
December 31, 2014
(dollars in thousands) FICO Score
Estimated Current LTV Less than 610 Greater than or
equal to 610 Total(1)
<80% $ 453,309 $ 10,118,404 $ 10,571,713
80%–100% 354,041 7,854,631 8,208,672
100+% 70,870 1,201,442 1,272,312
LTV not available(2) 152,644 74,818 227,462
Total $ 1,030,864 $ 19,249,295 $ 20,280,159
(1)Excludes fair value adjustments associated with the ACI portfolio (See Note 5) of $(14.6) million, deferred income, net of $(117.0) million, other
adjustments of $(2.9) million and loans in process of $29.6 million.
(2)For this category, 83% of the loan balances are associated with the ACI portfolio.
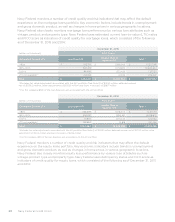
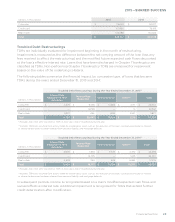
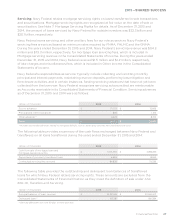
Navy Federal monitors a number of credit quality and risk indicators that may aect the default
experience on the equity loans portfolio. Key economic indicators include trends in unemployment
and gross domestic product, as well as changes in home prices in various geographic locations.
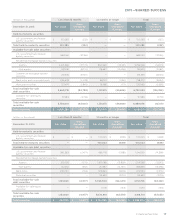
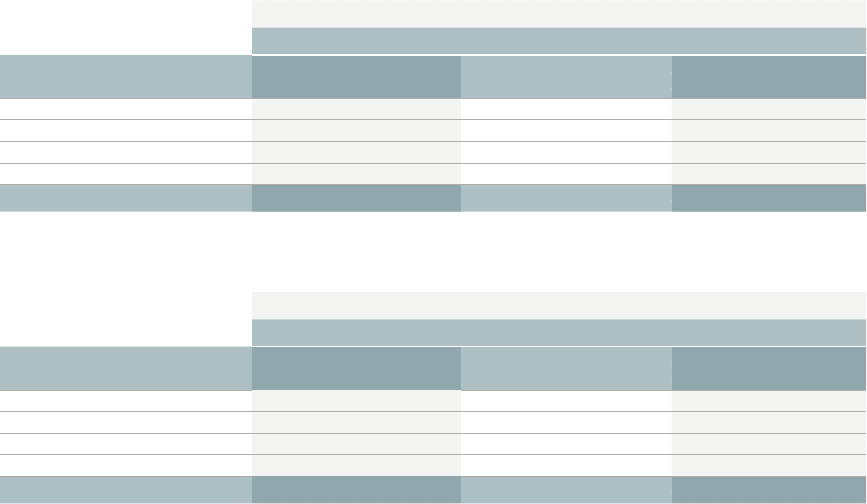
Navy Federal also closely monitors equity loan performance by various loan attributes such as
vintage, product type and property type. Navy Federal uses delinquency status and FICO score as
indicators of credit quality for equity loans, which consisted of the following as of December 31, 2015
and 2014: