Navy Federal Credit Union 2015 Annual Report Download - page 63
Download and view the complete annual report
Please find page 63 of the 2015 Navy Federal Credit Union annual report below. You can navigate through the pages in the report by either clicking on the pages listed below, or by using the keyword search tool below to find specific information within the annual report.-
 1
1 -
2
-
3
-
4
-
5
-
6
-
7
-
8
-
9
-
10
-
11
-
12
-
13
-
14
-
15
-
16
-
17
-
18
-
19
-
20
-
21
-
22
-
23
-
24
-
25
-
26
-
27
-
28
-
29
-
30
-
31
-
32
-
33
-
34
-
35
-
36
-
37
-
38
-
39
-
40
-
41
-
42
-
43
-
44
-
45
-
46
-
47
-
48
-
49
-
50
-
51
-
52
-
 53
53 -
 54
54 -
 55
55 -
 56
56 -
 57
57 -
 58
58 -
 59
59 -
 60
60 -
 61
61 -
 62
62 -
 63
63 -
 64
64 -
 65
65 -
 66
66 -
 67
67 -
 68
68 -
 69
69 -
 70
70 -
 71
71 -
 72
72 -
 73
73 -
74
-
75
-
76
-
77
-
78
 |
 |
Navy Federal Credit Union44
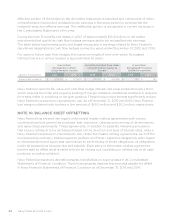
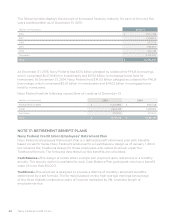
The anticipated employer contribution for 2016 is $25.0 million for the pension plan and
$2.5 million for the retiree medical benefit plan. The measurement date for the pension and
retiree medical benefit plan for 2015 and 2014 was December 31.
The investment strategy of the Navy Federal Credit Union Employees’ Retirement Plan is to
employ an investment approach, whereby a mix of equity and fixed-income investments are
used to maximize the long-term return of plan assets at a prudent level of risk that includes
consideration of benefit obligation volatility. The intent of this strategy is to keep the Plan
well-funded over the long run. Risk tolerance is established through careful consideration
of plan liabilities and plan-funded status. Investment risk is measured and monitored on an
ongoing basis through annual liability measurements, periodic asset/liability studies and
regular investment portfolio reviews.
At December 31, 2015, the target allocation of plan assets was 25% U.S. equity securities, 40%
global equity securities and 35% fixed-income securities. Most of the U.S. equity assets are
invested in a large company index fund with the balance invested in mid- and small-company
equity securities. Most of the global equity allocation is in developed markets around the world,
with the balance in emerging markets. The fixed-income allocation comprises a small allocation
to cash to provide liquidity for benefit and expense payments, with the balance invested in
intermediate- and long-term bonds, the majority of which are investment-grade.
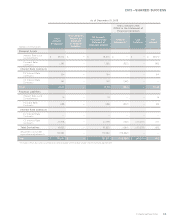
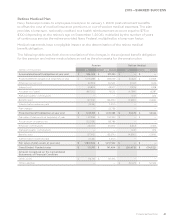
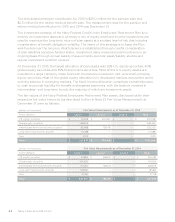
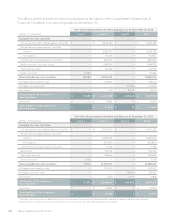
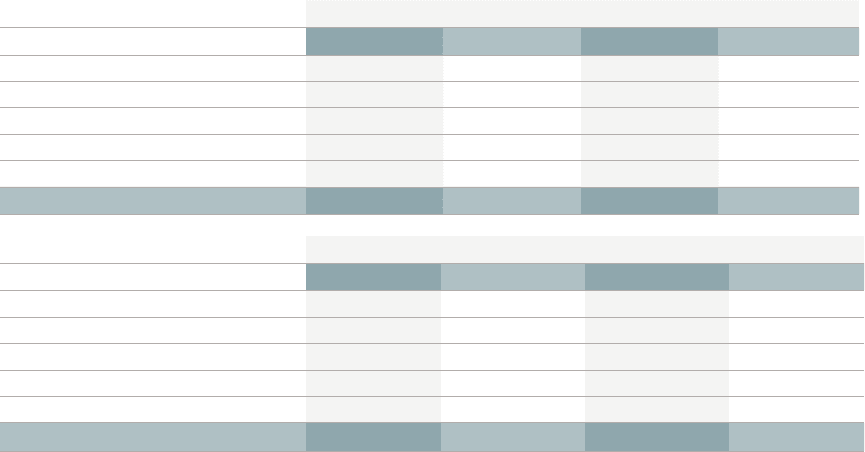
The fair values of the Navy Federal Employees’ Retirement Plan assets, disclosed within their
respective fair value hierarchy (as described further in Note 21: Fair Value Measurement) at
December 31 were as follows:
(dollars in thousands) Fair Value Measurements as of December 31, 2015
Asset Category Level 1 Level 2 Level 3 Total
U.S. equity securities $ 53,648 $ 240,390 $ — $ 294,038
Global equity securities 468,399 — — 468,399
Intermediate-term fixed-income securities 86,488 138,718 — 225,206
Long-term fixed-income securities 172,188 — — 172,188
Cash 21,115 — — 21,115
Total $ 801,838 $ 379,108 $ — $ 1,180,946
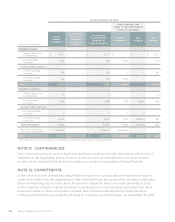
(dollars in thousands) Fair Value Measurements as of December 31, 2014
Asset Category Level 1 Level 2 Level 3 Total
U.S. equity securities $ 57,885 $ 248,647 $ — $ 306,532
Global equity securities 474,995 — — 474,995
Intermediate-term fixed-income securities 90,262 138,244 — 228,506
Long-term fixed-income securities 185,821 — — 185,821
Cash 21,728 — — 21,728
Total $ 830,691 $ 386,891 $ — $ 1,217,582