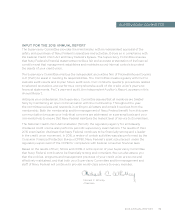
Navy Federal Credit Union 2015 Annual Report Download - page 24
Download and view the complete annual report
Please find page 24 of the 2015 Navy Federal Credit Union annual report below. You can navigate through the pages in the report by either clicking on the pages listed below, or by using the keyword search tool below to find specific information within the annual report.-
 1
1 -
2
-
3
-
4
-
5
-
6
-
7
-
8
-
9
-
10
-
11
-
12
-
13
-
 14
14 -
 15
15 -
 16
16 -
 17
17 -
 18
18 -
 19
19 -
 20
20 -
 21
21 -
 22
22 -
 23
23 -
 24
24 -
 25
25 -
 26
26 -
 27
27 -
 28
28 -
 29
29 -
 30
30 -
 31
31 -
 32
32 -
 33
33 -
 34
34 -
35
-
36
-
37
-
38
-
39
-
40
-
41
-
42
-
43
-
44
-
45
-
46
-
47
-
48
-
49
-
50
-
51
-
52
-
53
-
54
-
55
-
56
-
57
-
58
-
59
-
60
-
61
-
62
-
63
-
64
-
65
-
66
-
67
-
68
-
69
-
70
-
71
-
72
-
73
-
74
-
75
-
76
-
77
-
78
 |
 |

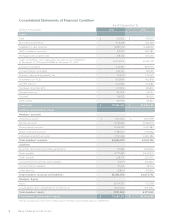
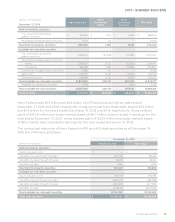
Financial Section 5
2015—SHARED SUCCESS
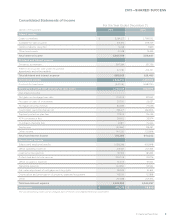
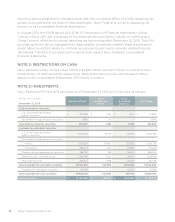
Consolidated Statements of Cash Flows
(dollars in thousands) For the Year Ended December 31,
Cash flows from operating activities 2015 2014
Net income $ 872,219 $ 718,830
Adjustments to reconcile net income to net cash provided by operating activities:
Provision for loan losses 940,116 668,279
Depreciation and amortization of property, plant and equipment 143,061 123,818
(Gain)/loss on disposal of property, plant and equipment (512) 234
Net gain on sale of available-for-sale investment securities (25,700) (22,657)
Amortization of loan origination fees and costs 5,546 6,452
Gain/loss on valuation on mortgage servicing rights (28,024) 34,841
Mortgage loans originated for sale (5,074,969) (2,740,896)
Gain on sale of mortgages (151,730) (86,386)
Mortgage loan sales proceeds 4,853,727 2,774,377
Accretion and amortization of investment securities 61,790 47,524
Change in accounts receivable 425,747 (500,131)
Change in accrued interest receivable (7,242) (16,141)
Change in mortgage servicing rights (7,051) (34,063)
Change in prepaid expenses (10,953) (10,508)
Change in other intangible assets — 383
Change in other assets (80,778) (25,203)
Change in drafts payable 7,532 (2,227)
Change in accrued expenses and accounts payable 68,068 64,598
Change in accrued interest payable 1,444 1,033
Change in other liabilities 23,331 49,823
Net cash provided by operating activities 2,015,622 1,051,980
Cash flows from investing activities
Net (increase)/decrease in short-term investments (1,760,710) 61,204
Purchases of AFS investment securities (4,027,609) (3,385,490)
Purchases of HTM investment securities — (149,711)
Proceeds from maturities, paydowns and calls of AFS investment securities 1,697,437 944,437
Proceeds from sales of AFS investment securities 1,528,158 1,584,758
Proceeds from maturities, paydowns and calls of HTM investment securities 54,456 157,646
Net purchases of FHLB stock (179,968) (130,246)
Proceeds from loans sold originated for investment 36,193 43,906
Net increase in loans to members (7,819,608) (7,215,815)
Purchases of property, plant and equipment (248,925) (248,465)
Increase in NCUSIF deposit (39,296) (34,126)
Proceeds from sale of real estate owned 25,552 30,491
Net cash used in investing activities (10,734,320) (8,341,411)
Cash flows from financing activities
Net increase in members’ accounts 4,711,674 4,130,158
Net (decrease)/increase in securities sold under repurchase agreements (749,520) 65,203
Proceeds from borrowings 30,372,155 6,300,000
Repayments of borrowings (25,541,500) (3,281,635)
Net cash provided by financing activities 8,792,809 7,213,726
Net increase/(decrease) in cash 74,111 (75,705)
Cash at beginning of year 426,201 501,906
Cash at end of year $ 500,312 $ 426,201
Supplemental cash flow information:
Interest paid $ 660,015 $ 625,450
Transfers from loans to other assets 26,015 28,866
Loan securitization 255,545 —
The accompanying notes are an integral part of these consolidated financial statements.