Xerox 2004 Annual Report Download - page 95
Download and view the complete annual report
Please find page 95 of the 2004 Xerox annual report below. You can navigate through the pages in the report by either clicking on the pages listed below, or by using the keyword search tool below to find specific information within the annual report.-
 1
1 -
2
-
3
-
4
-
5
-
6
-
7
-
8
-
9
-
10
-
11
-
12
-
13
-
14
-
15
-
16
-
17
-
18
-
19
-
20
-
21
-
22
-
23
-
24
-
25
-
26
-
27
-
28
-
29
-
30
-
31
-
32
-
33
-
34
-
35
-
36
-
37
-
38
-
39
-
40
-
41
-
42
-
43
-
44
-
45
-
46
-
47
-
48
-
49
-
50
-
51
-
52
-
53
-
54
-
55
-
56
-
57
-
58
-
59
-
60
-
61
-
62
-
63
-
64
-
65
-
66
-
67
-
68
-
69
-
70
-
71
-
72
-
73
-
74
-
75
-
76
-
77
-
78
-
79
-
80
-
81
-
82
-
83
-
84
-
 85
85 -
 86
86 -
 87
87 -
 88
88 -
 89
89 -
 90
90 -
 91
91 -
 92
92 -
 93
93 -
 94
94 -
 95
95 -
 96
96 -
 97
97 -
 98
98 -
 99
99 -
 100
100
 |
 |

93
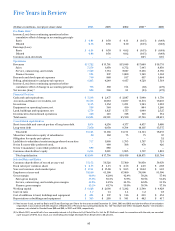
Five Years in Review
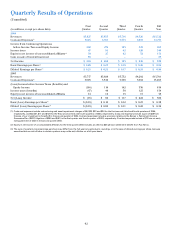
(Dollars in millions, except per-share data) 2004 2003 2002 2001(2) 2000
Per-Share Data(1)
Income (Loss) from continuing operations before
cumulative effect of change in accounting principle
Basic $ 0.84 $ 0.38 $ 0.11 $ (0.15) $ (0.48)
Diluted 0.78 0.36 0.10 (0.15) (0.48)
Earnings (Loss)
Basic $ 0.94 $ 0.38 $ 0.02 $ (0.15) $ (0.48)
Diluted 0.86 0.36 0.02 (0.15) (0.48)
Common stock dividends —— — 0.05 0.65
Operations
Revenues $15,722 $15,701 $15,849 $17,008 $18,751
Sales 7,259 6,970 6,752 7,443 8,839
Service, outsourcing, and rentals 7,529 7,734 8,097 8,436 8,750
Finance Income 934 997 1,000 1,129 1,162
Research and development expenses 760 868 917 997 1,064
Selling, administrative and general expenses 4,203 4,249 4,437 4,728 5,518
Income (Loss) from continuing operations before
cumulative effect of change in accounting principle 776 360 154 (92) (273)
Net income (loss)(1) 859 360 91 (94) (273)
Financial Position
Cash and cash equivalents $ 3,218 $ 2,477 $ 2,887 $ 3,990 $ 1,750
Accounts and finance receivables, net 10,573 10,972 11,077 11,574 13,067
Inventories 1,143 1,152 1,231 1,364 1,983
Equipment on operating leases, net 398 364 450 804 1,266
Land, buildings and equipment, net 1,759 1,827 1,757 1,999 2,527
Investment in discontinued operations 440 449 728 749 534
Total assets 24,884 24,591 25,550 27,746 28,291
Consolidated capitalization
Short-term debt and current portion of long-term debt 3,074 4,236 4,377 6,637 3,080
Long-term debt 7,050 6,930 9,794 10,107 15,557
Total debt 10,124 11,166 14,171 16,744 18,637
Minorities’ interests in equity of subsidiaries 80 102 73 73 87
Obligation for equity put options ————32
Liabilities to subsidiary trusts issuing preferred securities 717 1,809 1,793 1,787 721
Series B convertible preferred stock —499 508 470 426
Series C mandatory convertible preferred stock 889 889 — — —
Common shareholders’ equity 6,244 3,291 1,893 1,797 1,801
Total capitalization $18,054 $17,756 $18,438 $20,871 $21,704
Selected Data and Ratios
Common shareholders of record at year-end 55,152 56,326 57,300 59,830 59,879
Book value per common share $ 6.53 $ 4.15 $ 2.56 $ 2.49 $ 2.68
Year-end common stock market price $ 17.01 $ 13.80 $ 8.05 $ 10.42 $ 4.63
Employees at year-end 58,100 61,100 67,800 78,900 91,500
Gross margin 40.6% 42.0% 42.4% 38.2% 37.4%
Sales gross margin 35.4% 36.4% 37.3% 30.5% 31.2%
Service, outsourcing, and rentals gross margin 42.8% 44.3% 44.5% 42.2% 41.1%
Finance gross margin 63.1% 63.7% 59.9% 59.5% 57.1%
Working capital $ 4,628 $ 2,666 $ 3,242 $ 2,340 $ 4,928
Current ratio 1.7 1.4 1.4 1.2 1.8
Cost of additions to land, buildings and equipment $204 $ 197 $ 146 $ 219 $ 452
Depreciation on buildings and equipment $305 $ 299 $ 341 $ 402 $ 417
(1) Net income (loss), as well as Basic and Diluted Earnings per Share for the years ended December 31, 2004, 2003 and 2002 exclude the effect of amortization
of goodwill in accordance with the adoption of Statement of Financial Accounting Standards No. 142 “Goodwill and Other Intangible Assets.” Amortization
expense, net, related to Goodwill was $59 and $58, in 2001 and 2000, respectively.
(2) In March 2001, we sold half of our ownership interest in Fuji Xerox to Fuji Photo Film Co. Ltd. for $1.3 billion in cash. In connection with the sale, we recorded
apre-tax gain of $773. As a result, our ownership percentage decreased from 50 percent to 25 percent.