Xerox 2004 Annual Report Download - page 58
Download and view the complete annual report
Please find page 58 of the 2004 Xerox annual report below. You can navigate through the pages in the report by either clicking on the pages listed below, or by using the keyword search tool below to find specific information within the annual report.-
 1
1 -
2
-
3
-
4
-
5
-
6
-
7
-
8
-
9
-
10
-
11
-
12
-
13
-
14
-
15
-
16
-
17
-
18
-
19
-
20
-
21
-
22
-
23
-
24
-
25
-
26
-
27
-
28
-
29
-
30
-
31
-
32
-
33
-
34
-
35
-
36
-
37
-
38
-
39
-
40
-
41
-
42
-
43
-
44
-
45
-
46
-
47
-
 48
48 -
 49
49 -
 50
50 -
 51
51 -
 52
52 -
 53
53 -
 54
54 -
 55
55 -
 56
56 -
 57
57 -
 58
58 -
 59
59 -
 60
60 -
 61
61 -
 62
62 -
 63
63 -
 64
64 -
 65
65 -
 66
66 -
 67
67 -
 68
68 -
69
-
70
-
71
-
72
-
73
-
74
-
75
-
76
-
77
-
78
-
79
-
80
-
81
-
82
-
83
-
84
-
85
-
86
-
87
-
88
-
89
-
90
-
91
-
92
-
93
-
94
-
95
-
96
-
97
-
98
-
99
-
100
 |
 |

56
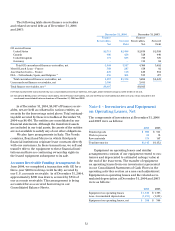
The following tables summarize the total amount
of costs expected to be incurred in connection with
these restructuring programs and the cumulative
amount incurred as of December 31, 2004:
Legacy Programs: The following is a summary of past
restructuring programs undertaken by the Company:
• Turnaround Program: The Turnaround Program
was initiated in October 2000 to reduce costs,
improveoperations, transition customer equipment
financing to third parties and sell certain assets. This
program included the outsourcing of certain Office
operating segment manufacturing to Flextronics, as
discussed in Note 18. Overall, approximately 11,200
positions were eliminated under this program.
• SOHO Disengagement: In 2001, we commenced a
separate restructuring program associated with the
disengagement from our worldwide small office/
home office (“SOHO”) business. The program
included provisions for the elimination of approxi-
mately 1,200 positions worldwide by the end of
2001, the closing of facilities and the write down of
certain assets to net realizable value.
• March 2000/April 1998 Programs: These programs
were likewise initiated to reduce overall costs and
included reductions in workforce as well as the con-
solidation of facilities on a worldwide basis. Overall,
approximately 14,200 positions were eliminated
under these programs.
Reversals of prior period charges were recorded
for these programs during the three-year period ended
December 31, 2004 primarily as a result of changes in
estimates associated with employee severance and
related costs.
Note 8 – Supplementary Financial
Information
The components of other current assets and other
current liabilities at December 31, 2004 and 2003 were
as follows:
2004 2003
Other current assets
Deferred taxes $ 289 $ 402
Restricted cash 370 386
Prepaid expenses 142 35
Financial derivative instruments 125 24
Other 256 258
Total $1,182 $1,105
Other current liabilities
Income taxes payable $183 $ 264
Other taxes payable 234 289
Interest payable 113 147
Restructuring reserves 93 180
Financial derivative instruments 46 51
Other 640 609
Total $1,309 $1,540
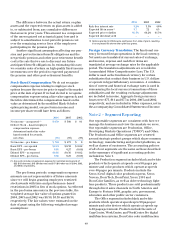
Segment Reporting:
Cumulative Net amount Cumulative
amount incurred for the amount
incurred as of year ended incurred as of Total expected
December 31, 2003 December 31, 2004 December 31, 2004 to be incurred*
Production $228 $ 27 $255 $255
Office 168 30 198 198
DMO 67 30 97 97
Other 116 6 122 126
Total Provisions $ 579 $ 93 $ 672 $ 676
*The total amount of $676 represents the cumulative amount incurred through December 31, 2004 plus $4 for interest accretion on the liabilities.
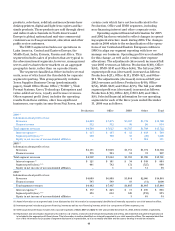
Major Cost Reporting:
Cumulative Amount Cumulative
amount incurred for the amount
incurred as of year ended incurred as of Total expected
December 31, 2003December 31, 2004 December 31, 2004 to be incurred*
Severance and related costs $483 $ 84 $ 567 $568
Lease cancellation and other costs 51 8 59 62
Asset impairments 45 1 46 46
Total Provisions $ 579 $ 93 $ 672 $ 676