Xerox 2004 Annual Report Download - page 68
Download and view the complete annual report
Please find page 68 of the 2004 Xerox annual report below. You can navigate through the pages in the report by either clicking on the pages listed below, or by using the keyword search tool below to find specific information within the annual report.-
 1
1 -
2
-
3
-
4
-
5
-
6
-
7
-
8
-
9
-
10
-
11
-
12
-
13
-
14
-
15
-
16
-
17
-
18
-
19
-
20
-
21
-
22
-
23
-
24
-
25
-
26
-
27
-
28
-
29
-
30
-
31
-
32
-
33
-
34
-
35
-
36
-
37
-
38
-
39
-
40
-
41
-
42
-
43
-
44
-
45
-
46
-
47
-
48
-
49
-
50
-
51
-
52
-
53
-
54
-
55
-
56
-
57
-
 58
58 -
 59
59 -
 60
60 -
 61
61 -
 62
62 -
 63
63 -
 64
64 -
 65
65 -
 66
66 -
 67
67 -
 68
68 -
 69
69 -
 70
70 -
 71
71 -
 72
72 -
 73
73 -
 74
74 -
 75
75 -
 76
76 -
 77
77 -
 78
78 -
79
-
80
-
81
-
82
-
83
-
84
-
85
-
86
-
87
-
88
-
89
-
90
-
91
-
92
-
93
-
94
-
95
-
96
-
97
-
98
-
99
-
100
 |
 |

66
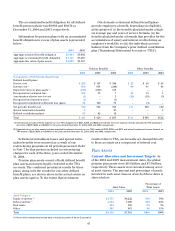
Investment Strategy: The target asset allocations for
our worldwide plans for 2004 were 59 percent invested
in equities, 34 percent invested in fixed income, 6 per-
cent invested in real estate and 1 percent invested in
Other. For 2003, the target asset allocations were 60 per-
cent invested in equities, 28 percent invested in fixed
income, 4 percent invested in real estate and 8 percent
invested in Other. The pension assets outside of the
U.S. as of the 2004 and 2003 measurement dates were
$4.1 billion and $3.4 billion, respectively.
The target asset allocations for the U.S. pension
plan include 64 percent invested in equities, 30
percent in fixed income, 5 percent in real estate and
1percent in other investments. Cash investments are
sufficient to handle expected cash requirements for
benefit payments and will vary throughout the year.
The expected long-term rate of return on the U.S.
pension assets is 8.75 percent.
Weemployatotal return investment approach
wherebyamix of equities and fixed income
investments are used to maximize the long-term
return of plan assets for a prudent level of risk. The
intent of this strategy is to minimize plan expenses by
exceeding the interest growth in long-term plan liabil-
ities. Risk tolerance is established through careful
consideration of plan liabilities, plan funded status,
and corporate financial condition. This consideration
involves the use of long-term measures that address
both return and risk. The investment portfolio contains
a diversified blend of equity and fixed income invest-
ments. Furthermore, equity investments are diversified
across U.S and non-U.S. stocks as well as growth,
value, and small and large capitalizations. Other
assets such as real estate, private equity, and hedge
funds are used to improve portfolio diversification.
Derivatives may be used to hedge market exposure in
an efficient and timely manner; however, derivatives
maynot be used to leverage the portfolio beyond the
market value of the underlying investments. Investment
risks and returns are measured and monitored on an
ongoing basis through annual liability measurements
and quarterly investment portfolio reviews.
Expected Long Term Rate of Return: Weemploy a
“building block” approach in determining the long-term
rate of return for plan assets. Historical markets are
studied and long-term relationships between equities
and fixed income are assessed. Current market factors
such as inflation and interest rates are evaluated before
long-term capital market assumptions are determined.
The long-term portfolio return is established giving
consideration to investment diversification and
rebalancing. Peer data and historical returns are
reviewed periodically to assess reasonableness and
appropriateness.
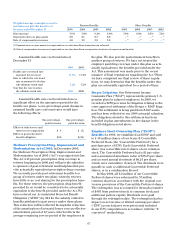
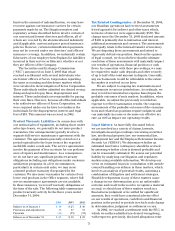
Contributions: We expect to contribute $114 to our
worldwide pension plans and $128 to our other post
retirement benefit plans in 2005. The 2005 expected
pension plan contributions do not include any
planned contribution for the domestic tax qualified
plans because there are no required contributions to
these plans for the 2005fiscal year. However, once the
January 1, 2005 actuarial valuations and projected
results as of the end of the 2005measurement year are
available, the desirability of additional contributions
will be assessed. Based on these results, we may vol-
untarily decide to contribute to these plans, even
though no contribution is required.
Estimated Future BenefitPayments: The following
benefit payments, which reflect expected future serv-
ice, as appropriate, are expected to be paid:
Pension Other
Benefits Benefits
2005 $ 672 $128
2006 444 122
2007 489 124
2008 496 125
2009 571 127
Years 2010-2014 3,653 633
Assumptions
Weighted-average assumptions used to
determine benefitobligations at the Pension Benefits Other Benefits
plan measurement dates 20042003 2002 2004 2003 2002
Discount rate 5.6% 5.8% 6.2% 5.8% 6.0% 6.5%
Rate of compensation increase 4.0 3.9 3.9 —(1) —(1) —(1)
(1) Rate of compensation increase is not applicable to our other benefits as compensation levels do not impact earned benefits.