Xerox 2004 Annual Report Download - page 94
Download and view the complete annual report
Please find page 94 of the 2004 Xerox annual report below. You can navigate through the pages in the report by either clicking on the pages listed below, or by using the keyword search tool below to find specific information within the annual report.-
 1
1 -
2
-
3
-
4
-
5
-
6
-
7
-
8
-
9
-
10
-
11
-
12
-
13
-
14
-
15
-
16
-
17
-
18
-
19
-
20
-
21
-
22
-
23
-
24
-
25
-
26
-
27
-
28
-
29
-
30
-
31
-
32
-
33
-
34
-
35
-
36
-
37
-
38
-
39
-
40
-
41
-
42
-
43
-
44
-
45
-
46
-
47
-
48
-
49
-
50
-
51
-
52
-
53
-
54
-
55
-
56
-
57
-
58
-
59
-
60
-
61
-
62
-
63
-
64
-
65
-
66
-
67
-
68
-
69
-
70
-
71
-
72
-
73
-
74
-
75
-
76
-
77
-
78
-
79
-
80
-
81
-
82
-
83
-
 84
84 -
 85
85 -
 86
86 -
 87
87 -
 88
88 -
 89
89 -
 90
90 -
 91
91 -
 92
92 -
 93
93 -
 94
94 -
 95
95 -
 96
96 -
 97
97 -
 98
98 -
 99
99 -
 100
100
 |
 |

92
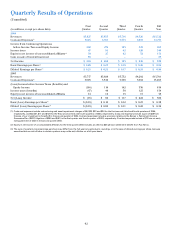
Quarterly Results of Operations
(Unaudited)
First Second Third Fourth Full
(in millions, except per-share data) Quarter Quarter Quarter Quarter Year
2004
Revenues $3,827 $3,853 $3,716 $4,326 $15,722
Costs and Expenses(1) 3,625 3,581 3,553 3,998 14,757
Income from Continuing Operations
before Income Taxes and Equity Income 202 272 163 328 965
Income taxes 67 91 62 120 340
Equity in net income of unconsolidated affiliates(2) 30 27 62 32 151
Gain on sale of ContentGuard, net 83 — — — 83
Net Income $248 $ 208 $ 163 $ 240 $ 859
Basic Earnings per Share(3) $0.28 $ 0.23 $ 0.18 $ 0.26 $ 0.94
Diluted Earnings per Share(3) $0.25 $ 0.21 $ 0.17 $ 0.24 $ 0.86
2003
Revenues $3,757 $3,920 $3,732 $4,292 $15,701
Costs and Expenses(1) 3,903 3,810 3,590 3,962 15,265
(Loss) Income before Income Taxes (Benefits) and
Equity Income (146) 110 142 330 436
Income taxes (benefits) (67) 40 38 123 134
Equity in net income of unconsolidated affiliates 14 16 13 15 58
Net (Loss) Income $ (65) $ 86 $ 117 $ 222 $ 360
Basic (Loss) Earnings per Share(3) $(0.10) $0.10 $0.12 $0.25 $ 0.38
Diluted (Loss) Earnings per Share(3) $(0.10) $0.09 $ 0.11 $ 0.22 $ 0.36
(1) Costs and expenses include restructuring and asset impairment charges of $6, $33, $23 and $24 for the first, second, third and fourth quarters of 2004,
respectively,and $8, $37, $11 and $120 for the first, second, third and fourth quarters of 2003, respectively. Costs and expenses include a gain of $38 from
the sale of our investment in ScanSoft in the second quarter of 2004. Cost and expenses include a provision relating to the Berger v. Retirement Income
Guarantee Plan (RIGP) litigation of $300 and $(61) in the first quarter and fourth quarter of 2003, respectively. Cost and expenses include a $73 loss on early
extinguishment of debt in the second quarter 2003.
(2) Equity in net income of unconsolidated affiliates for the third quarter 2004 includes an after-tax $38 pension settlement benefit from Fuji Xerox.
(3) The sum of quarterly (loss) earnings per share may differ from the full-year amounts due to rounding, or in the case of diluted earnings per share, because
securities that are anti-dilutive in certain quarters may not be anti-dilutive on a full-year basis.