Xerox 2004 Annual Report Download - page 33
Download and view the complete annual report
Please find page 33 of the 2004 Xerox annual report below. You can navigate through the pages in the report by either clicking on the pages listed below, or by using the keyword search tool below to find specific information within the annual report.-
 1
1 -
2
-
3
-
4
-
5
-
6
-
7
-
8
-
9
-
10
-
11
-
12
-
13
-
14
-
15
-
16
-
17
-
18
-
19
-
20
-
21
-
22
-
 23
23 -
 24
24 -
 25
25 -
 26
26 -
 27
27 -
 28
28 -
 29
29 -
 30
30 -
 31
31 -
 32
32 -
 33
33 -
 34
34 -
 35
35 -
 36
36 -
 37
37 -
 38
38 -
 39
39 -
 40
40 -
 41
41 -
 42
42 -
 43
43 -
44
-
45
-
46
-
47
-
48
-
49
-
50
-
51
-
52
-
53
-
54
-
55
-
56
-
57
-
58
-
59
-
60
-
61
-
62
-
63
-
64
-
65
-
66
-
67
-
68
-
69
-
70
-
71
-
72
-
73
-
74
-
75
-
76
-
77
-
78
-
79
-
80
-
81
-
82
-
83
-
84
-
85
-
86
-
87
-
88
-
89
-
90
-
91
-
92
-
93
-
94
-
95
-
96
-
97
-
98
-
99
-
100
 |
 |

31
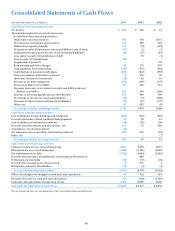
$258 million reflecting the increase in equipment sale
revenue in 2003 and an increased on-lease equipment
investment of $39 million. These items were partially
offset by increased pre-tax income of $332 million,
lower tax payments of $235 million and increased
cash proceeds from the early termination of interest
rate swaps of $80 million. The lower tax payments
reflect the absence of the $346 million tax payment
associated with the 2001 sale of a portion of our
ownership interest in Fuji Xerox.
We expect operating cash flows to be between
$1.0 billion and $1.5 billion in 2005, as compared to
$1.8 billion in 2004. The reduction includes the expected
change in finance receivables consistent with expected
equipment sales expansion, along with expected on-
lease equipment growth as well as the absence of early
derivative contract termination cash flow.
Investing: Investing cash flows for the year ended
December 31, 2004 of $203 million included $191 mil-
lion proceeds from the sale of businesses and invest-
ments, primarily consisting of $66million from the
ContentGuard sale, $79 million from the ScanSoft sale
and $36million from a preferred stock investment. In
addition, $223million was released from restricted
cash during the period primarily related to the renego-
tiation of certain secured borrowing arrangements
and scheduled releases from an escrowaccount sup-
porting interest payments on our liability to a trust
issuing preferred securities. We also received $53 mil-
lion of proceeds from the sale of certain excess land
and buildings. These aggregate proceeds were partially
offset by capital and internal use software spending of
$252 million. We expect 2005 capital expenditures to
approximate $250 million.
Investing cash flows for the year ended
December 31, 2003 of $49 million consisted primarily
of $235 million released from restricted cash related
to former reinsurance obligations associated with our
discontinued operations, $35 million of aggregate cash
proceeds from the divestiture of our investment in
Xerox South Africa, XES France and Germany and
other minor investments, partially offset by capital
and internal use software spending of $250 million.
Financing: Cash usage from financing activities for
the year ended December 31, 2004 of $1.3 billion
included payments of scheduled maturities on Euro
and Dollar denominated term debt of $2.1 billion,
net payments of other debt totaling $101 million and
preferred stock dividends of $83 million. These net
payments were partially offset by net proceeds of
$750 million from the issuance of the 2011 Senior
Notes, net proceeds from secured borrowing activity
of $155 million and proceeds from stock options
exercises of $73 million.
Cash usage from financing activities for the year
ended December 31, 2003 of $2.5 billion included net
payments on our 2002 credit facility of $3.5 billion,
net payments on term and other debt of $2.0 billion
and preferred stock dividends of $57 million. These
payments were partially offset by net proceeds from
secured borrowing activity of $269 million and the
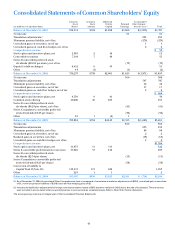
following activity related to the completion of our
June 2003 recapitalization plan-net proceeds from the
convertible preferred stock offering of $889 million,
net proceeds from the common stock offering of
$451 million, net proceeds from the 2010 and 2013
Senior Notes of $1.2 billion and net proceeds from
the 2003 Credit Facility of $271 million.
Customer Financing Activities and Debt: We
provide equipment financing to the majority of our
customers. Because the finance leases allow our cus-
tomers to payfor equipment over time rather than at
the date of installation, wemaintain a certain level of
debt to support our investment in these customer
finance leases. We have funded a significant portion
of our finance receivables through third-party secured
funding arrangements. Under these arrangements,
debt is secured by the finance receivables it supports,
which eliminates certain significant refinancing, pric-
ing and duration risks associated with our debt. In
addition to these third party arrangements, we support
our customer finance leasing with cash generated
from operations and through capital markets offerings.
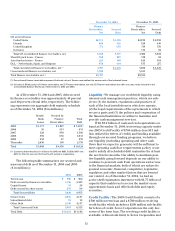
During the years ended December 31, 2004 and
2003, we borrowed $2.1 billion and $2.5 billion,
respectively, under third-party secured funding
arrangements. Approximately 60 percent of our total
finance receivable portfolio has been pledged to
secure funding at both December 31, 2004 and
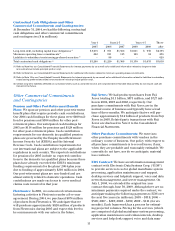
December 31, 2003. The following table compares
finance receivables to financing-related debt as of
December 31, 2004 and 2003 ($ in millions):