Xerox 2004 Annual Report Download - page 50
Download and view the complete annual report
Please find page 50 of the 2004 Xerox annual report below. You can navigate through the pages in the report by either clicking on the pages listed below, or by using the keyword search tool below to find specific information within the annual report.-
 1
1 -
2
-
3
-
4
-
5
-
6
-
7
-
8
-
9
-
10
-
11
-
12
-
13
-
14
-
15
-
16
-
17
-
18
-
19
-
20
-
21
-
22
-
23
-
24
-
25
-
26
-
27
-
28
-
29
-
30
-
31
-
32
-
33
-
34
-
35
-
36
-
37
-
38
-
39
-
 40
40 -
 41
41 -
 42
42 -
 43
43 -
 44
44 -
 45
45 -
 46
46 -
 47
47 -
 48
48 -
 49
49 -
 50
50 -
 51
51 -
 52
52 -
 53
53 -
 54
54 -
 55
55 -
 56
56 -
 57
57 -
 58
58 -
 59
59 -
 60
60 -
61
-
62
-
63
-
64
-
65
-
66
-
67
-
68
-
69
-
70
-
71
-
72
-
73
-
74
-
75
-
76
-
77
-
78
-
79
-
80
-
81
-
82
-
83
-
84
-
85
-
86
-
87
-
88
-
89
-
90
-
91
-
92
-
93
-
94
-
95
-
96
-
97
-
98
-
99
-
100
 |
 |

48
The difference between the actual return on plan
assets and the expected return on plan assets is added
to, or subtracted from, any cumulative differences
that arose in prior years. This amount is a component
of the unrecognized net actuarial (gain) loss and is
subject to amortization to net periodic pension cost
over the remaining service lives of the employees
participating in the pension plan.
Another significant assumption affecting our pen-
sion and post-retirement benefit obligations and the
net periodic pension and other post-retirement benefit
cost is the rate that we use to discount our future
anticipated benefit obligations. In estimating this rate,
we consider rates of return on high quality fixed-income
investments over the period to expected payment of
the pension and other post-retirement benefits.
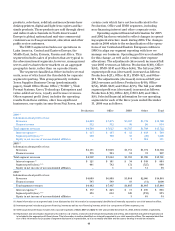
Stock-Based Compensation: We do not recognize
compensation expense relating to employee stock
options because the exercise price is equal to the market
price at the date of grant. If we had elected to recognize
compensation expense using a fair value approach, and
therefore determined the compensation based on the
value as determined by the modified Black-Scholes
option pricing model, our pro forma income and
income per share would have been as follows:
20042003 2002
Net income – as reported (1) $ 859 $ 360 $ 91
Deduct: Stock – based employee
compensation expense
determined under fair value
based method for awards,
net of tax (69) (85) (83)
Net income – pro forma $790 $275 $ 8
Basic EPS – as reported $0.94 $ 0.38 $ 0.02
Basic EPS – pro forma 0.86 0.27 (0.09)
Diluted EPS – as reported $0.86$ 0.36 $ 0.02
Diluted EPS – pro forma 0.80 0.25 (0.09)
(1) Amounts include compensation expense for restricted stock grants of
$22 ($13 after-tax), $15 ($9 after-tax) and $17 ($10 after-tax) in 2004, 2003,
and 2002, respectively.
The pro forma periodic compensation expense
amounts are not representativeof future amounts
since we will begin granting employees restricted
stock awards with time-and performance-based
restrictions in 2005 in lieu of stock options. As reflected
in the pro forma amounts in the previous table, the
weighted-average fair value of options granted in
2004, 2003 and 2002 was $8.38, $5.39 and $6.34,
respectively. The fair values were estimated on the
date of grant using the following weighted average
assumptions:
2004 2003 2002
Risk-free interest rate 3.2% 3.3% 4.8%
Expected life in years(1) 5.7 7.2 6.5
Expected price volatility 66.5% 66.2% 61.5%
Expected dividend yield —— —
(1) Options granted in 2004 expire eight years from date of grant, resulting
in an expected life shorter than previous grants.
Foreign Currency Translation: The functional cur-
rency for most foreign operations is the local currency.
Net assets are translated at current rates of exchange,
and income, expense and cash flow items are
translated at average exchange rates for the applicable
period. The translation adjustments are recorded in
Accumulated Other Comprehensive Loss. The U.S.
dollar is used as the functional currency for certain
subsidiaries that conduct their business in U.S. dollars
or operate in hyperinflationary economies. A combina-
tion of current and historical exchange rates is used in
remeasuring the local currency transactions of these
subsidiaries and the resulting exchange adjustments
are included in income. Aggregate foreign currency
losses were $73, $11 and $77 in 2004, 2003 and 2002,
respectively, and are included in Other expenses, net in
the accompanying Consolidated Statements of Income.
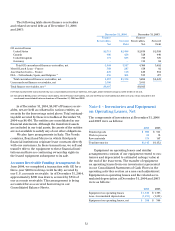
Note 2 – Segment Reporting
Our reportable segments are consistent with how we
manage the business and view the markets we serve.
Our reportable segments are Production, Office,
Developing Markets Operations (“DMO”) and Other.
The Production and Office segments are centered
around strategic product groups which share common
technology, manufacturing and product platforms, as
well as classes of customers. The accounting policies
of all of our segments are the same as those described
in the summary of significant accounting policies
included in Note 1.
The Production segment includes black and white
products which operate at speeds over 90 pages per
minute and color products which operate at speeds
over 40 pages per minute. Products include the
Xerox iGen3 digital color production press, Xerox
Nuvera, DocuTech, DocuPrint, Xerox 2101 and
DocuColor families, as well as older technology light-
lens products. These products are sold predominantly
through direct sales channels in North America and
Europe to Fortune 1000, graphic arts, government,
education and other public sector customers.
The Office segment includes black and white
products which operate at speeds up to 90 pages per
minute and color devices which operate at speeds up
to 40 pages per minute. Products include the suite of
CopyCentre, WorkCentre, and WorkCentre Pro digital
multifunction systems, DocuColor color multifunction