Xerox 2004 Annual Report Download - page 28
Download and view the complete annual report
Please find page 28 of the 2004 Xerox annual report below. You can navigate through the pages in the report by either clicking on the pages listed below, or by using the keyword search tool below to find specific information within the annual report.-
 1
1 -
2
-
3
-
4
-
5
-
6
-
7
-
8
-
9
-
10
-
11
-
12
-
13
-
14
-
15
-
16
-
17
-
 18
18 -
 19
19 -
 20
20 -
 21
21 -
 22
22 -
 23
23 -
 24
24 -
 25
25 -
 26
26 -
 27
27 -
 28
28 -
 29
29 -
 30
30 -
 31
31 -
 32
32 -
 33
33 -
 34
34 -
 35
35 -
 36
36 -
 37
37 -
 38
38 -
39
-
40
-
41
-
42
-
43
-
44
-
45
-
46
-
47
-
48
-
49
-
50
-
51
-
52
-
53
-
54
-
55
-
56
-
57
-
58
-
59
-
60
-
61
-
62
-
63
-
64
-
65
-
66
-
67
-
68
-
69
-
70
-
71
-
72
-
73
-
74
-
75
-
76
-
77
-
78
-
79
-
80
-
81
-
82
-
83
-
84
-
85
-
86
-
87
-
88
-
89
-
90
-
91
-
92
-
93
-
94
-
95
-
96
-
97
-
98
-
99
-
100
 |
 |

26
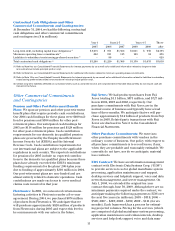
supplies and service revenue. DMO 2003 post sale
and other revenue declined 14 percent from 2002, due
largely to a lower rental equipment population at cus-
tomer locations and related page volume declines.
Other: 2004 post sale and other revenue declined
1percent from 2003, as declines in SOHO were essen-
tially offset by currency benefits and growth in Value-
added Services as well as other activity. Other 2003
post sale and other revenue declined 11 percent from
2002, reflecting supply sale declines in SOHO of
$82 million as well as the absence of $50 million of
third-party licensing revenue recognized in 2002.
2005 Projected Revenues
We expect 2005 equipment sales will continue to
grow, as we anticipate that new platforms and products
launched in 2003, 2004 and those planned in 2005 will
enable us to further strengthen our market position.
Compared to 2004, we expect 2005 post sale and other
revenue declines to continue to moderate throughout
the year and ultimately transition to growth before
year-end. Growth in post sale and other revenue will
be driven by our success at increasing the amount of
our equipment at customer locations and the volume
of pages and mix of color pages generated on that
equipment. We expect 2005 total revenues to increase
approximately 3 percent from 2004 levels.
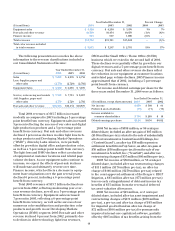
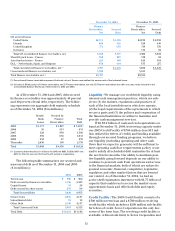
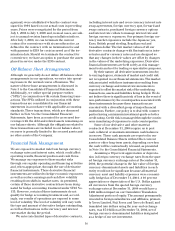
Segment Operating Profit
Segment operating profit and operating margin for the
three years ended December 31, 2004 were as follows
($ in millions):
Production Office DMO Other Total
2004
Operating Profit $388 $798 $ 43 $ (29) $1,200
Operating Margin 8.5% 10.5% 2.5% (1.6)% 7.6%
2003
Operating Profit $401 $ 742 $172 $ (327) $ 988
Operating Margin 8.9% 9.7% 9.8% (18.3)% 6.3%
2002
Operating Profit $436 $612 $120 $(335) $ 833
Operating Margin 9.7% 8.2% 6.4% (16.8)% 5.3%
Production: 2004 operating profit declined $13 million
and operating margin declined 0.4 percentage points
from 2003. The declines primarily reflect lower gross
margin and investments in selling and marketing
expenses, which were partially offset by R&D efficien-
cies and lower bad debt expenses. Production 2003
operating profitdeclined $35million from 2002, reflect-
ing lower gross margins related to initial installations of
the Xerox iGen3 digital color production press and
Xerox 2101. The decrease in gross margins was only
partially offset by lower R&D and SAG expenses.
Office: 2004operating profit improved $56 million
and operating margin improved 0.8 percentage points
from 2003. The improvements primarily reflect mod-
est improvement in gross margins, general and
administrative expense productivity, and lower bad
debt expense. Office 2003 operating profit improved
$130million from 2002, reflecting improved gross
margins driven primarily by improved manufacturing
and service productivity, as well as lower R&D and
SAG expenses.
DMO: 2004 operating profit declined $129 million
from 2003primarily reflecting results in Latin America
where the pace of revenue declines have exceeded
cost and expense reductions. DMO 2003 operating
profit improved $52 million from 2002 due to signifi-
cantly lower SAG spending resulting from our cost
saving initiatives, lower bad debts and gains on
currency exposures compared to currency exposure
losses in 2002. These improvements were partially
offset by lower gross margins as a result of declining
post sale revenue.
Other: 2004 Other segment operating loss of $29 mil-
lion improved by $298 million as compared to 2003,
principally due to reduced non-financing interest
expense of $159 million, an increase in equity income
from Fuji Xerox of $93 million and the gain on sale
of our interest in ScanSoft of $38 million. 2003 Other
segment operating loss of $327 million decreased by
$8 million from 2002.
Employee Stock Ownership Plan (ESOP): In 2002,
our Board of Directors reinstated the dividend on
our ESOP, which resulted in a reversal of previously
recorded compensation expense. The reversal of
compensation expense corresponded to the line item
in the Consolidated Statement of Income for 2002