Xerox 2004 Annual Report Download - page 32
Download and view the complete annual report
Please find page 32 of the 2004 Xerox annual report below. You can navigate through the pages in the report by either clicking on the pages listed below, or by using the keyword search tool below to find specific information within the annual report.-
 1
1 -
2
-
3
-
4
-
5
-
6
-
7
-
8
-
9
-
10
-
11
-
12
-
13
-
14
-
15
-
16
-
17
-
18
-
19
-
20
-
21
-
 22
22 -
 23
23 -
 24
24 -
 25
25 -
 26
26 -
 27
27 -
 28
28 -
 29
29 -
 30
30 -
 31
31 -
 32
32 -
 33
33 -
 34
34 -
 35
35 -
 36
36 -
 37
37 -
 38
38 -
 39
39 -
 40
40 -
 41
41 -
 42
42 -
43
-
44
-
45
-
46
-
47
-
48
-
49
-
50
-
51
-
52
-
53
-
54
-
55
-
56
-
57
-
58
-
59
-
60
-
61
-
62
-
63
-
64
-
65
-
66
-
67
-
68
-
69
-
70
-
71
-
72
-
73
-
74
-
75
-
76
-
77
-
78
-
79
-
80
-
81
-
82
-
83
-
84
-
85
-
86
-
87
-
88
-
89
-
90
-
91
-
92
-
93
-
94
-
95
-
96
-
97
-
98
-
99
-
100
 |
 |

30
The difference between the 2003 consolidated
effective tax rate of 30.7 percent and the U.S. federal
statutory income tax rate of 35 percent relates prima-
rily to $35 million of tax benefits arising from the
reversal of valuation allowances on deferred tax assets
following a re-evaluation of their future realization
due to improved financial performance, other foreign
adjustments, including earnings taxed at different
rates, the impact of Series B Convertible Preferred
Stock dividends and state tax benefits. Such benefits
were partially offset by tax expense for audit and other
tax return adjustments, as well as $19 million of
unrecognized tax benefits primarily related to recur-
ring losses in certain jurisdictions where we continue
to maintain deferred tax asset valuation allowances.
The difference between the 2002 consolidated
effective tax rate of 3.8 percent and the U.S. federal
statutory income tax rate of 35 percent relates prima-
rily to the recognition of tax benefits resulting from
the favorable resolution of a foreign tax audit of
approximately $79 million, tax law changes of
approximately $26million and the impact of Series B
Convertible Preferred Stock dividends. Such benefits
were offset, in part, by tax expense recorded for the
on-going examination in India, the sale of our interest
in Katun Corporation, as well as recurring losses in
certain jurisdictions where weare not providing tax
benefits and continue to maintain deferred tax asset
valuation allowances.
Our consolidated effective income tax rate will
change based on discrete events (such as audit
settlements) as well as other factors including the
geographical mix of income before taxes and the
related tax rates in those jurisdictions. Weanticipate
that our 2005annual consolidated effective tax rate
will approximate 38 percent.
Equity in Net Income of Unconsolidated
Affiliates: Equity in net income of unconsolidated
affiliates increased $93 million in 2004 as compared to
2003. This account is principally related to our 25 per-
cent share of Fuji Xerox income. As discussed in Note
6to the Consolidated Financial Statements, equity
income for 2004 included $38 million related to our
share of a pension settlement gain recorded by Fuji
Xerox due to a non-recurring opportunity given to
Japanese companies by the Japanese government in
accordance with the Japan Welfare Pension Insurance
Law. This law allowed Japanese companies to transfer
aportion of their pension obligations to the Japanese
government. The remainder of the 2004 increase is
primarily due to the improved operational perform-
ance of Fuji Xerox. Our 2003 equity in net income of
$58 million was comparable with the 2002 result of
$54million.
In 2004, we recorded a Gain on sale of
ContentGuard relating to the sale of all but 2 percent
of our 75 percent ownership interest in ContentGuard.
The sale, which is disclosed in Note 18 to the
Consolidated Financial Statements, resulted in an
after-tax gain of approximately $83 million ($109 mil-
lion pre-tax).
Recent Accounting Pronouncements: See Note 1
of the Consolidated Financial Statements for a full
description of recent accounting pronouncements
including the respective dates of adoption and effects
on results of operations and financial condition.
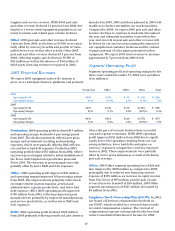
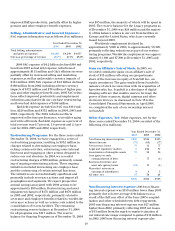
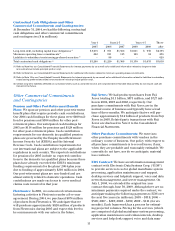
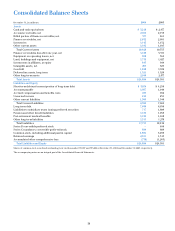
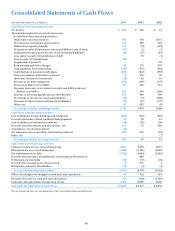
Capital Resources and Liquidity
Cash Flow Analysis: The following summarizes our
cash flows for each of the three years ended December
31, 2004, as reported in our Consolidated Statements
of Cash Flows in the accompanying Consolidated
Financial Statements ($ in millions):
2004 2003 2002
Net cash provided by
operating activities $ 1,750 $ 1,879 $ 1,980
Net cash provided by
investing activities 203 49 93
Net cash used in
financing activities (1,293) (2,470) (3,292)
Effect of exchange rate
changes on cash 81 132 116
Increase (decrease) in cash
and cash equivalents 741 (410) (1,103)
Cash and cash equivalents
at beginning of year 2,477 2,887 3,990
Cash and cash equivalents
at end of year $ 3,218 $ 2,477 $ 2,887
Operating: For the year ended December 31, 2004,
operating cash flows were $1.8 billion, a decrease
of $129million over the same period in 2003. The
decrease primarily results from lower finance receiv-
able reductions of $159 million reflecting the increase
in equipment sale revenue in 2004, higher cash usage
related to inventory of $100 million to support new
product launches and increased tax payments of
$46million due to increased income. In addition,
there was lower cash generation from the early
termination of interest rate swaps of $62 million.
These cash outflows were partially offset by lower
pension plan contributions of $263million.
For the year ended December 31, 2003, operating
cash flows were $1.9 billion, a decrease of $101 mil-
lion over the same period in 2002. The decrease pri-
marily reflects increased pension plan contributions
of $534 million, lower finance receivable reductions of