Xerox 2004 Annual Report Download - page 29
Download and view the complete annual report
Please find page 29 of the 2004 Xerox annual report below. You can navigate through the pages in the report by either clicking on the pages listed below, or by using the keyword search tool below to find specific information within the annual report.-
 1
1 -
2
-
3
-
4
-
5
-
6
-
7
-
8
-
9
-
10
-
11
-
12
-
13
-
14
-
15
-
16
-
17
-
18
-
 19
19 -
 20
20 -
 21
21 -
 22
22 -
 23
23 -
 24
24 -
 25
25 -
 26
26 -
 27
27 -
 28
28 -
 29
29 -
 30
30 -
 31
31 -
 32
32 -
 33
33 -
 34
34 -
 35
35 -
 36
36 -
 37
37 -
 38
38 -
 39
39 -
40
-
41
-
42
-
43
-
44
-
45
-
46
-
47
-
48
-
49
-
50
-
51
-
52
-
53
-
54
-
55
-
56
-
57
-
58
-
59
-
60
-
61
-
62
-
63
-
64
-
65
-
66
-
67
-
68
-
69
-
70
-
71
-
72
-
73
-
74
-
75
-
76
-
77
-
78
-
79
-
80
-
81
-
82
-
83
-
84
-
85
-
86
-
87
-
88
-
89
-
90
-
91
-
92
-
93
-
94
-
95
-
96
-
97
-
98
-
99
-
100
 |
 |

27
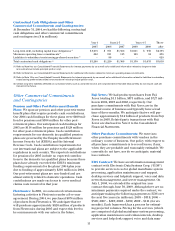
where the charge was originally recorded and included
$28 million in both Cost of Sales and Selling, adminis-
trative and general expenses and $11 million in
Research and Development expenses. Of the total
compensation expense originally recorded, $34 mil-
lion and $33 million was recognized in 2002 and 2001,
respectively. As such, 2002 benefited by the reversal of
$33 million of excess compensation expense that was
originally recorded in 2001. There is no corresponding
earnings per share improvement in 2002 since the
EPS calculation requires deduction of dividends
declared from reported net income in arriving at net
income available to common shareholders. See Note
12 to the Consolidated Financial Statements for a more
complete discussion of the ESOP.
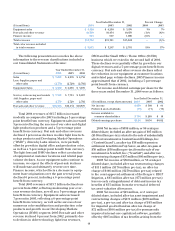
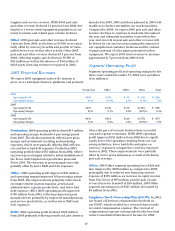
Gross Margin: Gross margins by revenue classifica-
tion were as follows:
Year Ended December 31,
2004 2003 2002
Total gross margin 40.6% 42.0% 42.4%
Sales 35.4% 36.4% 37.3%
Service, outsourcing and rentals 42.8% 44.3% 44.5%
Finance income 63.1% 63.7% 59.9%
2004 gross margin of 40.6 percent declined
1.4 percentage points from 2003. Approximately
0.8 percentage points of the decline is due to product
mix impacts from a greater proportion of lower
gross margin products in the Office and Production
segments. Approximately 0.6 percentage points of the
decline reflects the impact from DMO results. The
declines in DMO relate to Brazil’s revenue, which has
declined faster than declines in its cost levels and
product mix to lower gross margin products in various
DMO geographies. Lower prices were approximately
offset by productivity improvements.
2004 sales gross margin of 35.4 percent declined
1percentage point from 2003. Approximately 0.4 per-
centage points of the decline results from product mix
and DMO results contributed 0.6 percentage points to
the decline. Additionally, productivity improvements
offset lower prices and other variances.
2004 service, outsourcing, and rentals gross mar-
gin of 42.8 percent declined 1.5 percentage points from
2003. The majority of the decline is attributed to prod-
uct mix in the Office and Production segments as well
as DMO results. Productivity and cost improvements
offset lower prices for the year.
The 2003 gross margin of 42.0 percent declined
0.4 percentage points from 2002. During 2003, we
completed the R&D phase of the XeroxiGen3 digital
color production press development and, therefore,
beginning in July 2003 ongoing engineering costs
associated with initial commercial production were
included in cost of sales. Xerox iGen3 digital color
production press ongoing engineering costs of
$30 million, the absence of the $28 million prior
year favorable ESOP adjustment and the absence
of $50 million in prior year licensing revenue each
contributed 0.2 percentage points to the 2003 gross
margin decline. During 2003, manufacturing and
service productivity improvements more than offset
the impact of lower prices, higher pension and other
employee benefit costs and product mix.
2003 sales gross margin declined 0.9 percentage
points from 2002, with over half of the decline due to
Xerox iGen3 digital color production press ongoing
engineering costs and the remainder due to product
mix as we increased our penetration of the digital light
production market. In 2003, manufacturing productivi-
ty more than offset the impact of planned lower prices.
2003 service, outsourcing and rentals margin declined
0.2 percentage points from 2002. Improved productivi-
ty and product mix more than offset lower prices and
higher pension and other employee expenses. 2002
also included a 0.4 percentage point benefitfrom a
$50 million licensing agreement and a 0.3 percentage
point benefitdue to favorable ESOP adjustments.
2004 Finance income gross margins decreased
0.6 percentage points from 2003due to interest costs
specificto equipment financing. Equipment financing
interest expense is determined based on a combination
of actual interest expense incurred on financing debt,
as well as our estimated cost of funds, applied against
the estimated level of debt required to support our
finance receivables. The estimate is based on an
assumed ratio which ranges from 80-90% of our aver-
age finance receivables. This methodology has been
consistently applied for all periods presented. 2003
Finance income gross margins increased 3.8 percent-
age points from 2002, in line with declining interest
costs specific to equipment financing.
Research and Development: 2004 R&D expense of
$760 million was $108 million lower than the prior
year, primarily due to improved efficiencies as we cap-
ture benefits from our platform development strategy
as well as the commercial launch of the Xerox iGen3.
We continue to invest in technological development,
particularly in color, and believe that our R&D spend-
ing is at an adequate level to remain technologically
competitive. We expect 2005 R&D spending to approx-
imate 5 percent of total revenue. Our R&D is strategi-
cally coordinated with that of Fuji Xerox, which
invested $704 million and $724 million in R&D in 2004
and 2003, respectively.
2003 R&D spending of $868 million was $49 mil-
lion lower than 2002, primarily due to a $30 million
reduction associated with the commercial launch of
the XeroxiGen3 digital color production press and