Xerox 2004 Annual Report Download - page 67
Download and view the complete annual report
Please find page 67 of the 2004 Xerox annual report below. You can navigate through the pages in the report by either clicking on the pages listed below, or by using the keyword search tool below to find specific information within the annual report.-
 1
1 -
2
-
3
-
4
-
5
-
6
-
7
-
8
-
9
-
10
-
11
-
12
-
13
-
14
-
15
-
16
-
17
-
18
-
19
-
20
-
21
-
22
-
23
-
24
-
25
-
26
-
27
-
28
-
29
-
30
-
31
-
32
-
33
-
34
-
35
-
36
-
37
-
38
-
39
-
40
-
41
-
42
-
43
-
44
-
45
-
46
-
47
-
48
-
49
-
50
-
51
-
52
-
53
-
54
-
55
-
56
-
 57
57 -
 58
58 -
 59
59 -
 60
60 -
 61
61 -
 62
62 -
 63
63 -
 64
64 -
 65
65 -
 66
66 -
 67
67 -
 68
68 -
 69
69 -
 70
70 -
 71
71 -
 72
72 -
 73
73 -
 74
74 -
 75
75 -
 76
76 -
 77
77 -
78
-
79
-
80
-
81
-
82
-
83
-
84
-
85
-
86
-
87
-
88
-
89
-
90
-
91
-
92
-
93
-
94
-
95
-
96
-
97
-
98
-
99
-
100
 |
 |

65
Our domestic retirement defined benefit plans
provide employees a benefit, depending on eligibility,
at the greater of (i) the benefit calculated under a high-
est average pay and years of service formula, (ii) the
benefit calculated under a formula that provides for the
accumulation of salary and interest credits during an
employee’s work life, or (iii) the individual account
balance from the Company’s prior defined contribution
plan (Transitional Retirement Account or “TRA”).
Settlement/curtailment losses and special termi-
nation benefits were incurred as a result of our
restructuring programs in all periods presented. Refer
to Note 7 for that portion included in restructuring
charges for each of the three years ended December
31, 2004.
Pension plan assets consist of both defined benefit
plan assets and assets legally restricted to the TRA
accounts. The combined investment results for these
plans, along with the results for our other defined
benefit plans, are shown above in the actual return on
plan assets caption. To the extent that investment
results relate to TRA, such results are charged directly
to these accounts as a component of interest cost.
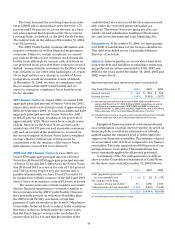
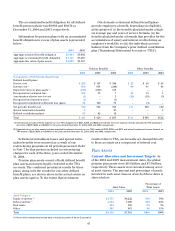
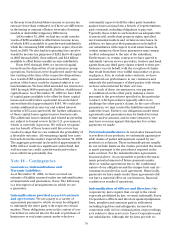
Plan Assets
Current Allocation and Investment Targets: As
of the 2004 and 2003 measurement dates, the global
pension plan assets were $8.1 billion and $7.3 billion,
respectively. These assets were invested among sever-
al asset classes. The amount and percentage of assets
invested in each asset class as of each of these dates is
shown below:
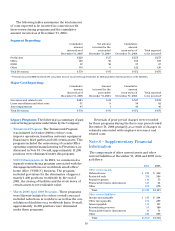
Pension Benefits Other Benefits
2004 2003 2002 2004 2003 2002
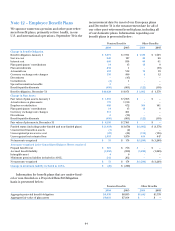
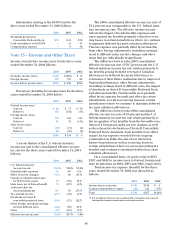
Components of Net Periodic Benefit Cost
Defined benefit plans
Service cost $ 222 $ 197 $ 180 $22 $ 26 $ 26
Interest cost (1) 660 934 (210) 89 91 96
Expected return on plan assets (2) (678) (940) 134 ———
Recognized net actuarial loss 104 53 7 24 13 3
Amortization of prior service cost (1) —3(24) (18) (5)
Recognized net transition asset (1) —(1) ———
Recognized curtailment/settlement loss (gain) 44 120 55 —(4) —
Net periodic benefit cost 350 364 168 111 108 120
Special termination benefits 2—27 ——2
Defined contribution plans 69 62 10 ———
Total $ 421 $ 426 $ 205 $111 $ 108 $122
(1)Interest cost includes interest expense on non-TRA obligations of $331, $289, and $238 and interest (income) expense directly allocated to TRA participant
accounts of $329, $645, and $(448) for the years ended December 31, 2004, 2003 and 2002, respectively.
(2) Expected return on plan assets includes expected investment income on non-TRA assets of $349, $295, and $314 and actual investment income (losses) on
TRA assets of $329, $645, and $(448) for the years ended December 31, 2004, 2003 and 2002, respectively.
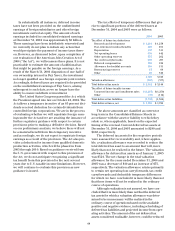
The accumulated benefit obligation for all defined
benefit pension plans was $8,966 and $8,036 at
December 31, 2004 and 2003, respectively.
Information for pension plans with an accumulated
benefit obligation in excess of plan assets is presented
below:
2004 2003
Aggregate projected benefit obligation $ 6,464 $5,882
Aggregate accumulated benefit obligation $ 5,727 $5,207
Aggregate fair value of plan assets $ 4,668 $4,367
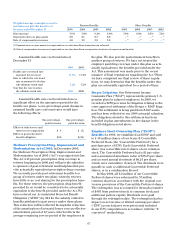
Percentage of
Asset Value Total Assets
2004 2003 2004 2003
Asset Category
Equity securities (1) $4,753 $4,222 58% 58%
Debt securities (1) 2,592 1,900 32% 26%
Real estate 464 366 6% 5%
Other 301 813 4% 11%
Total $ 8,110 $7,301 100% 100%
(1) None of the investments include debt or equity securities of Xerox Corporation.