Xerox 2004 Annual Report Download - page 2
Download and view the complete annual report
Please find page 2 of the 2004 Xerox annual report below. You can navigate through the pages in the report by either clicking on the pages listed below, or by using the keyword search tool below to find specific information within the annual report.-
 1
1 -
 2
2 -
 3
3 -
 4
4 -
 5
5 -
 6
6 -
 7
7 -
 8
8 -
 9
9 -
 10
10 -
 11
11 -
 12
12 -
 13
13 -
14
-
15
-
16
-
17
-
18
-
19
-
20
-
21
-
22
-
23
-
24
-
25
-
26
-
27
-
28
-
29
-
30
-
31
-
32
-
33
-
34
-
35
-
36
-
37
-
38
-
39
-
40
-
41
-
42
-
43
-
44
-
45
-
46
-
47
-
48
-
49
-
50
-
51
-
52
-
53
-
54
-
55
-
56
-
57
-
58
-
59
-
60
-
61
-
62
-
63
-
64
-
65
-
66
-
67
-
68
-
69
-
70
-
71
-
72
-
73
-
74
-
75
-
76
-
77
-
78
-
79
-
80
-
81
-
82
-
83
-
84
-
85
-
86
-
87
-
88
-
89
-
90
-
91
-
92
-
93
-
94
-
95
-
96
-
97
-
98
-
99
-
100
 |
 |

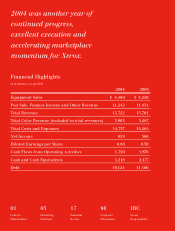
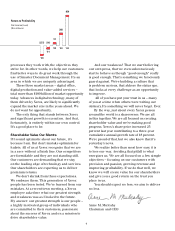
Financial Highlights
($ in millions, except EPS)
2004 2003
Equipment Sales $ 4,480 $ 4,250
Post Sale, Finance Income and Other Revenue 11,242 11,451
Total Revenue 15,722 15,701
Total Color Revenue (included in total revenues) 3,903 3,267
Total Costs and Expenses 14,757 15,265
Net Income 859 360
Diluted Earnings per Share 0.86 0.36
Cash Flowsfrom Operating Activities 1,750 1,879
Cash and Cash Equivalents 3,218 2,477
Debt 10,124 11,166
2004 was another year of
continued progress,
excellent execution and
accelerating marketplace
momentum for Xerox.
01
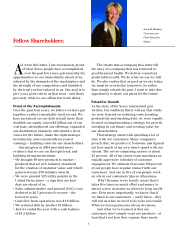
Letter to
Shareholders
05
Delivering
Solutions
17
Financial
Review
96
Corporate
Information
IBC
Social
Responsibility