Xerox 2004 Annual Report Download - page 85
Download and view the complete annual report
Please find page 85 of the 2004 Xerox annual report below. You can navigate through the pages in the report by either clicking on the pages listed below, or by using the keyword search tool below to find specific information within the annual report.-
 1
1 -
2
-
3
-
4
-
5
-
6
-
7
-
8
-
9
-
10
-
11
-
12
-
13
-
14
-
15
-
16
-
17
-
18
-
19
-
20
-
21
-
22
-
23
-
24
-
25
-
26
-
27
-
28
-
29
-
30
-
31
-
32
-
33
-
34
-
35
-
36
-
37
-
38
-
39
-
40
-
41
-
42
-
43
-
44
-
45
-
46
-
47
-
48
-
49
-
50
-
51
-
52
-
53
-
54
-
55
-
56
-
57
-
58
-
59
-
60
-
61
-
62
-
63
-
64
-
65
-
66
-
67
-
68
-
69
-
70
-
71
-
72
-
73
-
74
-
 75
75 -
 76
76 -
 77
77 -
 78
78 -
 79
79 -
 80
80 -
 81
81 -
 82
82 -
 83
83 -
 84
84 -
 85
85 -
 86
86 -
 87
87 -
 88
88 -
 89
89 -
 90
90 -
 91
91 -
 92
92 -
 93
93 -
 94
94 -
 95
95 -
96
-
97
-
98
-
99
-
100
 |
 |

83
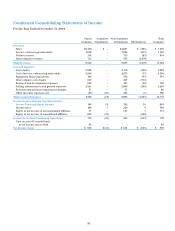
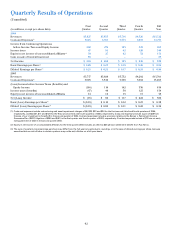
Condensed Consolidating Statements of Income
For the Year Ended December 31, 2004
Parent Guarantor Non-Guarantor Total
Company Subsidiaries Subsidiaries Eliminations Company
Revenues
Sales $3,469 $ — $4,081 $ (291) $ 7,259
Service, outsourcing and rentals 4,050 — 3,696 (217) 7,529
Finance income 314 — 713 (93) 934
Intercompany revenues 713 — 365 (1,078) —
Total Revenues 8,546 — 8,855 (1,679) 15,722
Cost and Expenses
Cost of sales 2,399 — 2,715 (426) 4,688
Cost of service, outsourcing and rentals 2,248 — 2,075 (17) 4,306
Equipment financing interest 106 — 332 (93) 345
Intercompany cost of sales 619 — 297 (916) —
Research and development expenses 669 — 127 (36) 760
Selling, administrative and general expenses 2,321 — 2,088 (206) 4,203
Restructuring and asset impairment charges 51 — 35 — 86
Other (income) expenses, net (35) (19) 424 (1) 369
Total Cost and Expenses 8,378 (19) 8,093 (1,695) 14,757
Income from Continuing Operations before
Income Taxes and Equity Income 168 19 762 16 965
Income taxes 100 7 229 4 340
Equity in net income of unconsolidated affiliates 15 — 131 5 151
Equity in net income of consolidated affiliates 693 (33) — (660) —
Income (Loss) from Continuing Operations 776 (21) 664 (643) 776
Gain on sale of ContentGuard,
net of income taxes of $26 83 — — — 83
Net Income (Loss) $ 859 $(21) $ 664 $ (643) $ 859