Xerox 2004 Annual Report Download - page 30
Download and view the complete annual report
Please find page 30 of the 2004 Xerox annual report below. You can navigate through the pages in the report by either clicking on the pages listed below, or by using the keyword search tool below to find specific information within the annual report.-
 1
1 -
2
-
3
-
4
-
5
-
6
-
7
-
8
-
9
-
10
-
11
-
12
-
13
-
14
-
15
-
16
-
17
-
18
-
19
-
 20
20 -
 21
21 -
 22
22 -
 23
23 -
 24
24 -
 25
25 -
 26
26 -
 27
27 -
 28
28 -
 29
29 -
 30
30 -
 31
31 -
 32
32 -
 33
33 -
 34
34 -
 35
35 -
 36
36 -
 37
37 -
 38
38 -
 39
39 -
 40
40 -
41
-
42
-
43
-
44
-
45
-
46
-
47
-
48
-
49
-
50
-
51
-
52
-
53
-
54
-
55
-
56
-
57
-
58
-
59
-
60
-
61
-
62
-
63
-
64
-
65
-
66
-
67
-
68
-
69
-
70
-
71
-
72
-
73
-
74
-
75
-
76
-
77
-
78
-
79
-
80
-
81
-
82
-
83
-
84
-
85
-
86
-
87
-
88
-
89
-
90
-
91
-
92
-
93
-
94
-
95
-
96
-
97
-
98
-
99
-
100
 |
 |

28
improved R&D productivity, partially offset by higher
pension and other employee benefit expenses.
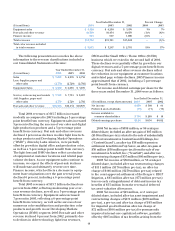
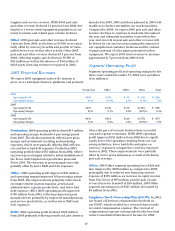
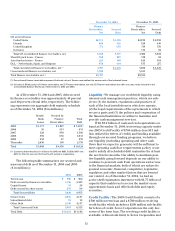
Selling, Administrative and General Expenses:
SAG expense information was as follows ($ in millions):
Year Ended December 31,
2004 2003 2002
Total Selling, administrative
and general expenses $4,203 $4,249 $4,437
SAG as a percentage of revenue 26.7% 27.1% 28.0%
2004 SAG expense of $4.2 billion declined $46 mil-
lion from 2003 as bad debt expense reductions of
approximately $115 million and G&A efficiencies were
partially offset byincreased selling and marketing
expenses as well as unfavorable currency impacts of
$141 million. 2003 SAG expense of $4.2 billion declined
$188million from 2002including adverse currency
impacts of $172 million and $70 million of higher pen-
sion and other employee benefit costs. 2003 SAG reduc-
tions reflect improved productivity and employment
reductions associated with our cost base restructuring
and lower bad debt expenses of $109 million.
Bad debt expense included in SAG was $110 mil-
lion, $224 million and $332 million in 2004, 2003 and
2002, respectively. The 2004 reduction reflects
improved collections performance, receivables aging
and write-off trends. Bad debt expense as a percent of
total revenue was 0.7 percent, 1.4 percent and 2.1 per-
cent for 2004, 2003 and 2002, respectively.
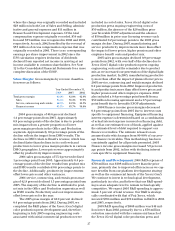
Restructuring Programs: For the three years ended
December 31, 2004, we have engaged in a series of
restructuring programs, resulting in $932 million in
charges related to downsizing our employee base,
exiting certain activities, outsourcing some internal
functions and engaging in other actions designed to
reduce our cost structure. In 2004, we recorded
restructuring charges of $86million, primarily consist-
ing of ongoing restructuring actions. These ongoing
initiatives included downsizing our employee base
and the outsourcing of certain internal functions.
The initiatives are not individually significant and
primarily include severance actions and impact all
geographies and segments. We expect prospective
annual savings associated with 2004actions to be
approximately $88 million. Restructuring and asset
impairment charges of $176million and $670 million
in 2003and 2002, respectively, primarily related to
severance and employee benefits related to worldwide
severance actions as well as certain costs related to the
consolidation of excess facilities. The remaining
restructuring reserve balance at December 31, 2004
for all programs was $117 million. The reserve
balance for Ongoing Programs as of December 31, 2004
was $93 million, the majority of which will be spent in
2005. The reserve balance for the Legacy programs as
of December 31, 2004 was $24 million and the majori-
ty of this balance relates to our exit from facilities in
Europe and the United States, which are currently
leased beyond 2008.
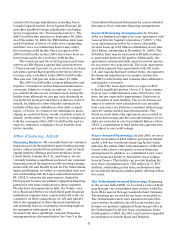
Worldwide employment declined by
approximately 3,000 in 2004, to approximately 58,100,
primarily reflecting reductions as part of our restruc-
turing programs. Worldwide employment was approx-
imately 61,100 and 67,800 at December 31, 2003 and
2002, respectively.
Gain on Affiliate’s Sale of Stock: In 2003, we
recorded cumulative gains on an affiliate’s sale of
stock of $13 million reflecting our proportionate
share of the increase in equity of ScanSoft Inc., an
equity investment. The gain resulted from ScanSoft’s
issuance of stock in connection with its acquisition of
Speechworks, Inc. ScanSoft is a developer of digital
imaging software that enables users to leverage the
power of their scanners, digital cameras and other
electronic devices. As discussed in Note 18 to the
Consolidated Financial Statements, in April 2004,
wecompleted the sale of our ownership interest
in ScanSoft.
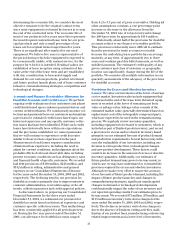
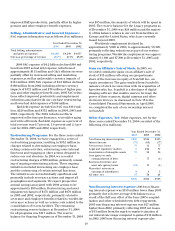
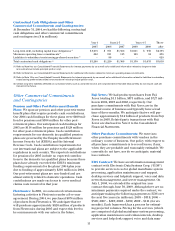
Other Expenses, Net: Other expenses, net for the
three years ended December 31, 2004 consisted of the
following ($ in millions):
Year Ended December 31,
2004 2003 2002
Non-financing interest expense $363 $522 $495
Interest income (75) (65) (77)
Net currency losses 73 11 77
Legal and regulatory matters 9242 37
Amortization of intangible assets 37 36 36
Loss (gain) on early
extinguishment of debt —73 (1)
Business divestiture and
asset sale (gains) losses (61) 13 (1)
Minorities’ interests in
earnings of subsidiaries 863
All other, net 15 38 24
$369 $876 $593
Non-financing interest expense: 2004non-financ-
ing interest expense was $159million lower than 2003
primarily due to lower average debt balances as a
result of the full year effect of the June 2003recapital-
ization and other scheduled term debt repayments.
2003 non-financing interest expense was $27 million
higher than 2002, primarily reflecting 2003 net losses
of $13 million from the mark-to-market valuation of
our interest rate swaps compared to gains of $12 million
in 2002. 2003 non-financing interest expense also