Xerox 2004 Annual Report Download - page 88
Download and view the complete annual report
Please find page 88 of the 2004 Xerox annual report below. You can navigate through the pages in the report by either clicking on the pages listed below, or by using the keyword search tool below to find specific information within the annual report.-
 1
1 -
2
-
3
-
4
-
5
-
6
-
7
-
8
-
9
-
10
-
11
-
12
-
13
-
14
-
15
-
16
-
17
-
18
-
19
-
20
-
21
-
22
-
23
-
24
-
25
-
26
-
27
-
28
-
29
-
30
-
31
-
32
-
33
-
34
-
35
-
36
-
37
-
38
-
39
-
40
-
41
-
42
-
43
-
44
-
45
-
46
-
47
-
48
-
49
-
50
-
51
-
52
-
53
-
54
-
55
-
56
-
57
-
58
-
59
-
60
-
61
-
62
-
63
-
64
-
65
-
66
-
67
-
68
-
69
-
70
-
71
-
72
-
73
-
74
-
75
-
76
-
77
-
 78
78 -
 79
79 -
 80
80 -
 81
81 -
 82
82 -
 83
83 -
 84
84 -
 85
85 -
 86
86 -
 87
87 -
 88
88 -
 89
89 -
 90
90 -
 91
91 -
 92
92 -
 93
93 -
 94
94 -
 95
95 -
 96
96 -
 97
97 -
 98
98 -
99
-
100
 |
 |

86
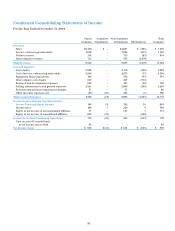
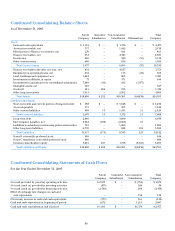
Condensed Consolidating Balance Sheets
As of December 31, 2003
Parent Guarantor Non-Guarantor Total
Company Subsidiaries Subsidiaries Eliminations Company
Assets
Cash and cash equivalents $ 1,101 $ — $ 1,376 $ — $ 2,477
Accounts receivable, net 717 — 1,442 — 2,159
Billed portion of finance receivables, net 270 — 191 — 461
Finance receivables, net 454 — 2,527 — 2,981
Inventories 669 — 520 (37) 1,152
Other current assets 466 — 639 — 1,105
Total Current Assets 3,677 — 6,695 (37) 10,335
Finance receivables due after one year, net 834 — 4,537 — 5,371
Equipment on operating leases, net 212 — 176 (24) 364
Land, buildings and equipment, net 1,024 — 803 — 1,827
Investments in affiliates, at equity 73 — 571 — 644
Investments in and advances to consolidated subsidiaries 7,849 (64) 192 (7,977) —
Intangible assets, net 325 — – — 325
Goodwill 491 296 935 — 1,722
Other long-term assets 1,611 — 2,392 — 4,003
Total Assets $16,096 $ 232 $16,301 $(8,038) $24,591
Liabilities and Equity
Short-term debt and current portion of long-term debt $588 $ — $ 3,648 $ — $ 4,236
Accounts payable 517 — 493 — 1,010
Other current liabilities 968 13 1,431 11 2,423
Total Current Liabilities 2,073 13 5,572 11 7,669
Long-term debt 2,840 — 4,090 — 6,930
Intercompany payables, net 3,042 (188) (2,869) 15 —
Liabilities to subsidiary trusts issuing preferred securities 743 — 1,066 — 1,809
Other long-term liabilities 2,719 — 684 101 3,504
Total Liabilities 11,417 (175) 8,543 127 19,912
Series B convertible preferred stock 499 — — — 499
Series C mandatory convertible preferred stock 889 — — — 889
Common shareholders’ equity 3,291 407 7,758 (8,165) 3,291
Total Liabilities and Equity $16,096 $ 232 $16,301 $(8,038) $24,591
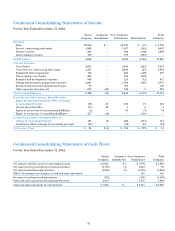
Condensed Consolidating Statements of Cash Flows
For the Year Ended December 31, 2003
Parent Guarantor Non-Guarantor Total
Company Subsidiaries Subsidiaries Company
Net cash provided by (used in) operating activities $ 2,673 $ — $ (794) $ 1,879
Net cash (used in) provided by investing activities (475) — 524 49
Net cash (used in) provided byfinancing activities (2,769) —299 (2,470)
Effect of exchange rate changes on cash and
cash equivalents — — 132 132
(Decrease) increase in cash and cash equivalents (571) —161 (410)
Cash and cash equivalents at beginning of period 1,672 — 1,215 2,887
Cash and cash equivalents at end of period $ 1,101 $ — $1,376 $ 2,477