Xerox 2004 Annual Report Download - page 21
Download and view the complete annual report
Please find page 21 of the 2004 Xerox annual report below. You can navigate through the pages in the report by either clicking on the pages listed below, or by using the keyword search tool below to find specific information within the annual report.-
 1
1 -
2
-
3
-
4
-
5
-
6
-
7
-
8
-
9
-
10
-
 11
11 -
 12
12 -
 13
13 -
 14
14 -
 15
15 -
 16
16 -
 17
17 -
 18
18 -
 19
19 -
 20
20 -
 21
21 -
 22
22 -
 23
23 -
 24
24 -
 25
25 -
 26
26 -
 27
27 -
 28
28 -
 29
29 -
 30
30 -
 31
31 -
32
-
33
-
34
-
35
-
36
-
37
-
38
-
39
-
40
-
41
-
42
-
43
-
44
-
45
-
46
-
47
-
48
-
49
-
50
-
51
-
52
-
53
-
54
-
55
-
56
-
57
-
58
-
59
-
60
-
61
-
62
-
63
-
64
-
65
-
66
-
67
-
68
-
69
-
70
-
71
-
72
-
73
-
74
-
75
-
76
-
77
-
78
-
79
-
80
-
81
-
82
-
83
-
84
-
85
-
86
-
87
-
88
-
89
-
90
-
91
-
92
-
93
-
94
-
95
-
96
-
97
-
98
-
99
-
100
 |
 |

19
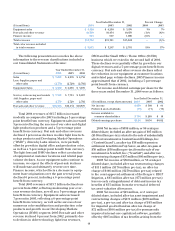
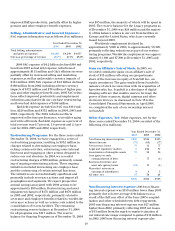
Year Ended December 31, Percent Change
($ in millions) 2004 2003 2002 2004 2003
Equipment sales $ 4,480 $ 4,250 $ 3,970 5% 7%
Post sale and other revenue 10,308 10,454 10,879 (1)% (4)%
Finance income 934 997 1,000 (6)% —
Total revenues $15,722 $15,701 $15,849 — (1)%
Total color revenue included
in total revenues $ 3,903 $ 3,267 $ 2,781 19% 17%
The following presentation reconciles the above
information to the revenue classifications included in
our Consolidated Statements of Income:
Year Ended December 31,
($ in millions) 2004 2003 2002
Sales $ 7,259 $ 6,970 $ 6,752
Less: Supplies, paper and
other sales (2,779) (2,720) (2,782)
Equipment Sales $ 4,480 $ 4,250 $ 3,970
Service, outsourcing and rentals $ 7,529 $ 7,734 $ 8,097
Add: Supplies, paper and
other sales 2,779 2,720 2,782
Post sale and other revenue $10,308 $10,454 $10,879
Total 2004 revenues of $15.7 billion increased
modestly as compared to 2003including a 3-percentage
point benefit from currency. Equipment sales increased
5percent reflecting the success of our color and digital
light production products and a 3-percentage point
benefit from currency. Post sale and other revenues
declined 1 percent as declines in older light lens tech-
nology products and Developing Market Operations
(“DMO”), driven by Latin America, were partially
offset by growth in digital office and production color,
as well as a 3-percentage point benefit from currency.
The light lens and DMO declines reflect a reduction
of equipment at customer locations and related page
volume declines. As our equipment sales continue to
increase, we expect the effects of post-sale declines
will moderate and ultimately reverse over time.
Finance income, which reflects a decrease in equip-
ment lease originations over the past several years,
declined 6 percent, including a 4-percentage point
benefit from currency.
Total 2003 revenues of $15.7 billion declined one
percent from 2002, reflecting moderating year-over-
year revenue declines, as well as a 5-percentage point
benefit from currency. Equipment sales increased
7percent in 2003, reflecting a 6-percentage point
benefit from currency, as well as the success of our
numerous color multifunction and production color
products and growth in our Developing Markets
Operations (DMO) segment. 2003 Post sale and other
revenue declined 4 percent from 2002, primarily due
to declines in older technology light lens revenues,
DMO and the Small Office / Home Office (SOHO)
business which we exited in the second half of 2001.
These declines were partially offset by growth in our
digital revenues and a 5-percentage point benefit from
currency. Post sale and other revenue declines reflect
the reduction in our equipment at customer locations
and related page volume declines. 2003 Finance income
approximated that of 2002, including a 5-percentage
point benefit from currency.
Net income and diluted earnings per share for the
three years ended December 31, 2004 were as follows:
Year Ended December 31,
($ in millions, except share amounts) 2004 2003 2002
Net income $ 859 $ 360 $ 91
Preferred stock dividends (73) (71) (73)
Income available to
common shareholders $ 786 $289 $ 18
Diluted earnings per share $0.86 $ 0.36 $ 0.02
2004 Net income of $859 million, or 86 cents per
diluted share, included an after-tax gain of $83 million
($109million pre-tax) related to the sale of substantially
all of our investment in ContentGuard Holdings, Inc.
(“ContentGuard”), an after-tax $38 million pension
settlement benefit from Fuji Xerox, an after-tax gain of
$30 million ($38 million pre-tax) from the sale of our
investment in ScanSoft, Inc. (“ScanSoft”) and after-tax
restructuring charges of $57 million ($86 million pre-tax).
2003 Net income of $360 million, or 36 cents per
diluted share, included after-tax restructuring charges
of $111 million ($176 million pre-tax), an after-tax
charge of $146 million ($239 million pre-tax) related
to the court approved settlement of the Berger v. RIGP
litigation, a $45 million after-tax ($73 million pre-tax)
loss on early extinguishment of debt and income tax
benefits of $35 million from the reversal of deferred
tax asset valuation allowances.
2002 Net income of $91 million, or 2 cents per
diluted share, included after-tax asset impairment and
restructuring charges of $471 million ($670 million
pre-tax), a pre-tax and after-tax charge of $63 million
for impaired goodwill and an after-tax charge of
$72million ($106million pre-tax) for permanently
impaired internal-use capitalized software, partially
offset by$105million of tax benefits arising from the